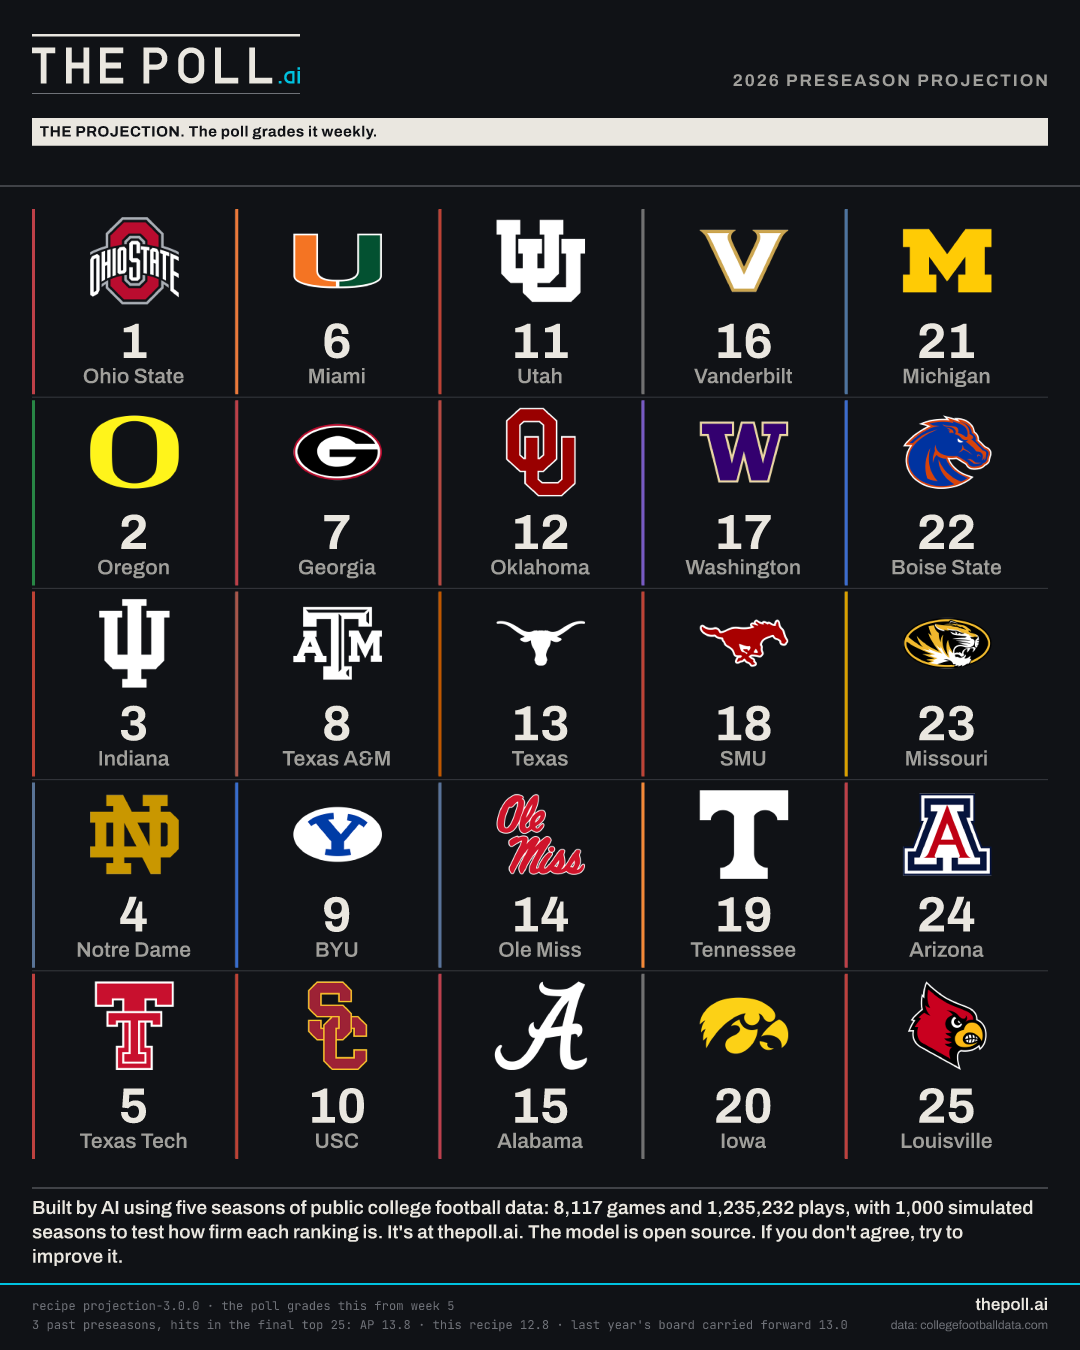
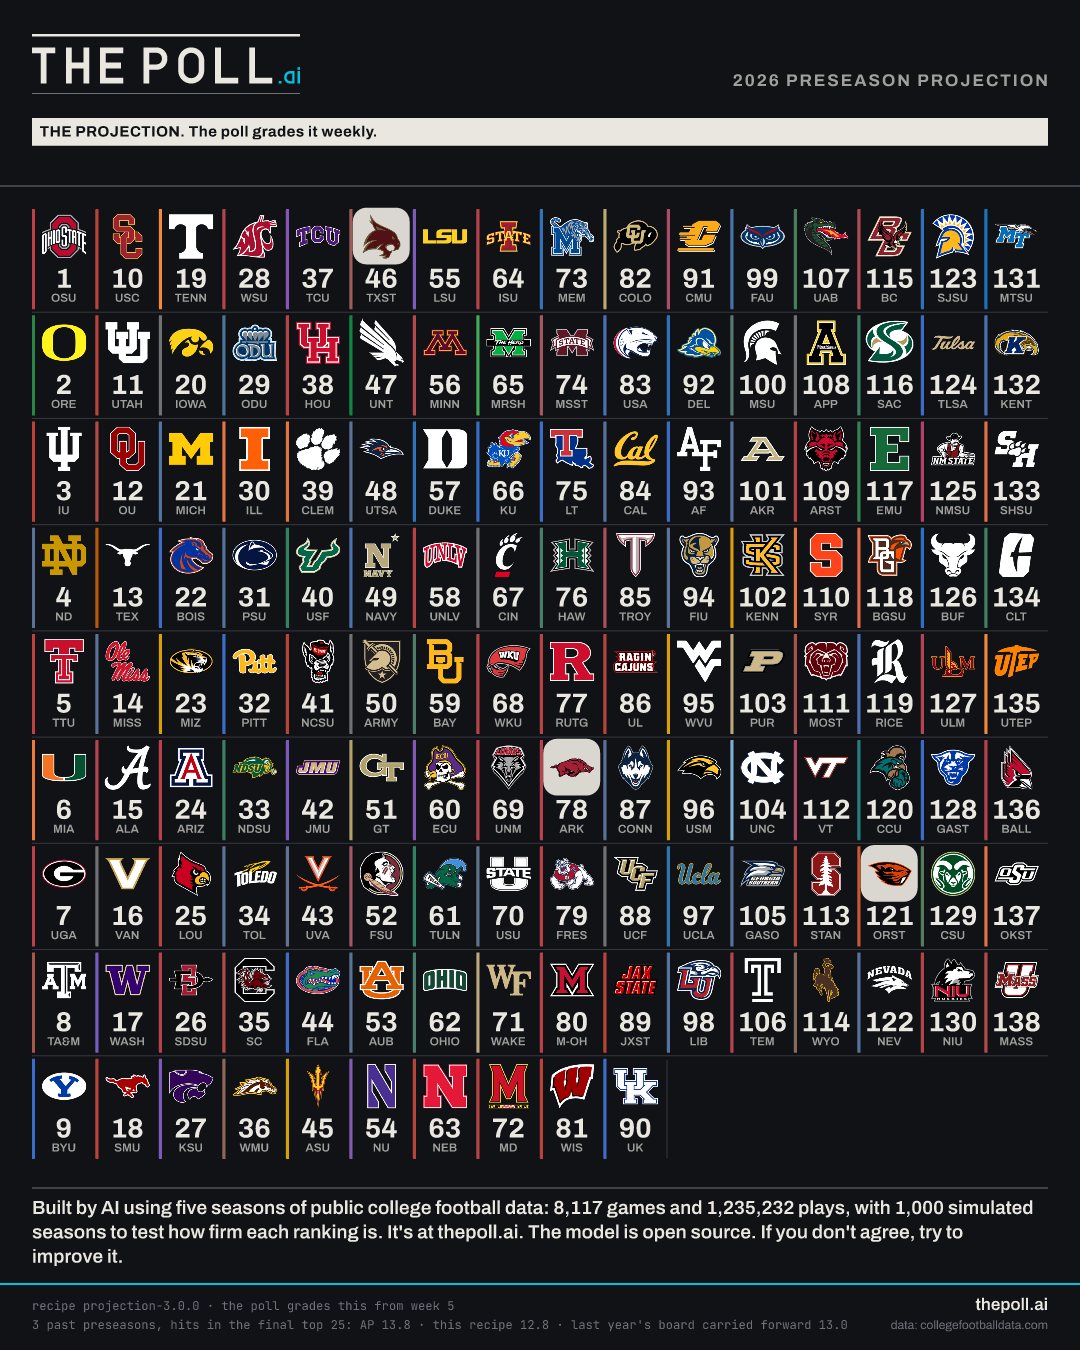
Closeprojected 1 of 138
Ohio State
Run on the one shared calendar every team is also scored against, the same team projects 9.8.
How good the model thinks they are
WEAKESTMIDDLESTRONGEST
1st of 138 · 22.7 rating, and it is what the board is sorted by
How hard their schedule is
EASIESTMIDDLEHARDEST
5th of 138 · 10.0 against a field whose middle is 4.9
home games7
conference, which the model never readsBig Ten
Ohio State returns most of last year's offense, worth 1.4 points of rating.
Every game: the chance the model gives this team, and the side it picks
| week | where | opponent | chance | call |
|---|
| 1 | home | Ball State | 97% | W |
| 2 | away | Texas | 55% | W |
| 3 | home | Kent State | 96% | W |
| 4 | home | Illinois | 84% | W |
| 5 | away | Iowa | 60% | W |
| 6 | home | Maryland | 89% | W |
| 7 | away | Indiana | 42% | L |
| 9 | away | USC | 52% | W |
| 10 | home | Oregon | 66% | W |
| 11 | home | Northwestern | 87% | W |
| 12 | away | Nebraska | 72% | W |
| 13 | home | Michigan | 81% | W |
Two numbers come out of that table Picking every favorite is not the same as expecting to win every one. A 75 percent favorite loses one week in four, so the wins always add up to fewer than the picks.
Projected wins8.8
Games it would pick11–1
The Host, on what the model found The four games Ohio State is least sure of are all on the road, and the only one the model calls a loss is at Indiana, 42 percent. Which road trip worries you most?
Run on the one shared calendar every team is also scored against, the same team projects 9.6.
How good the model thinks they are
WEAKESTMIDDLESTRONGEST
2nd of 138 · 21.0 rating, and it is what the board is sorted by
How hard their schedule is
EASIESTMIDDLEHARDEST
37th of 138 · 7.2 against a field whose middle is 4.9
home games7
conference, which the model never readsBig Ten
Oregon returns most of last year's offense, worth 1.2 points of rating.
Every game: the chance the model gives this team, and the side it picks
| week | where | opponent | chance | call |
|---|
| 1 | home | Boise State | 79% | W |
| 2 | away | Oklahoma State | 88% | W |
| 3 | home | Portland State · not rated: no offseason to read | 99% | W |
| 4 | away | USC | 48% | L |
| 6 | home | UCLA | 91% | W |
| 7 | home | Nebraska | 86% | W |
| 8 | away | Illinois | 61% | W |
| 9 | home | Northwestern | 85% | W |
| 10 | away | Ohio State | 34% | L |
| 11 | home | Michigan | 78% | W |
| 12 | away | Michigan State | 76% | W |
| 13 | home | Washington | 75% | W |
Two numbers come out of that table Picking every favorite is not the same as expecting to win every one. A 75 percent favorite loses one week in four, so the wins always add up to fewer than the picks.
Projected wins9.0
Games it would pick10–2
The Host, on what the model found Only one game on Oregon's card is anywhere near a coin flip: at USC, 48 percent. Set aside the trip to Ohio State and the other ten are all 61 percent or better. Does that look right?
projected 3 of 138
Indiana
Run on the one shared calendar every team is also scored against, the same team projects 9.5.
How good the model thinks they are
WEAKESTMIDDLESTRONGEST
3rd of 138 · 20.7 rating, and it is what the board is sorted by
How hard their schedule is
EASIESTMIDDLEHARDEST
23rd of 138 · 8.2 against a field whose middle is 4.9
home games8
conference, which the model never readsBig Ten
Indiana lost most of last year's offense, costing it 1.7 points of rating.
Every game: the chance the model gives this team, and the side it picks
| week | where | opponent | chance | call |
|---|
| 1 | home | North Texas | 83% | W |
| 2 | home | Howard · not rated: no offseason to read | 98% | W |
| 3 | home | Western Kentucky | 86% | W |
| 4 | home | Northwestern | 84% | W |
| 5 | away | Rutgers | 71% | W |
| 6 | away | Nebraska | 68% | W |
| 7 | home | Ohio State | 58% | W |
| 8 | away | Michigan | 56% | W |
| 9 | home | Minnesota | 85% | W |
| 11 | home | USC | 71% | W |
| 12 | away | Washington | 52% | W |
| 13 | home | Purdue | 91% | W |
Two numbers come out of that table Picking every favorite is not the same as expecting to win every one. A 75 percent favorite loses one week in four, so the wins always add up to fewer than the picks.
Projected wins9.0
Games it would pick12–0
The Host, on what the model found The model favors Indiana in all twelve games and still says 9-3, because a 75 percent favorite loses one week in four. Where do the three losses come from?
projected 4 of 138
Notre Dame
Run on the one shared calendar every team is also scored against, the same team projects 9.5.
How good the model thinks they are
WEAKESTMIDDLESTRONGEST
4th of 138 · 20.5 rating, and it is what the board is sorted by
How hard their schedule is
EASIESTMIDDLEHARDEST
62nd of 138 · 5.8 against a field whose middle is 4.9
home games6
conference, which the model never readsFBS Independents
Every game: the chance the model gives this team, and the side it picks
| week | where | opponent | chance | call |
|---|
| 1 | neutral | Wisconsin | 81% | W |
| 2 | home | Rice | 93% | W |
| 3 | home | Michigan State | 90% | W |
| 4 | away | Purdue | 77% | W |
| 5 | away | North Carolina | 77% | W |
| 6 | home | Stanford | 92% | W |
| 7 | away | BYU | 46% | L |
| 9 | neutral | Navy | 75% | W |
| 10 | home | Miami | 65% | W |
| 11 | home | Boston College | 92% | W |
| 12 | home | SMU | 76% | W |
| 13 | away | Syracuse | 78% | W |
Two numbers come out of that table Picking every favorite is not the same as expecting to win every one. A 75 percent favorite loses one week in four, so the wins always add up to fewer than the picks.
Projected wins9.4
Games it would pick11–1
The Host, on what the model found The only game Notre Dame is not favored in is at BYU, 46 percent, and it projects 9.4 wins on the 62nd hardest schedule of 138. Tell me which of those numbers you would move.
projected 5 of 138
Texas Tech
Run on the one shared calendar every team is also scored against, the same team projects 9.2.
How good the model thinks they are
WEAKESTMIDDLESTRONGEST
5th of 138 · 19.1 rating, and it is what the board is sorted by
How hard their schedule is
EASIESTMIDDLEHARDEST
83rd of 138 · 3.9 against a field whose middle is 4.9
home games7
conference, which the model never readsBig 12
Texas Tech returns most of last year's offense, worth 0.7 points of rating.
Every game: the chance the model gives this team, and the side it picks
| week | where | opponent | chance | call |
|---|
| 1 | home | Abilene Christian · not rated: no offseason to read | 94% | W |
| 2 | away | Oregon State | 78% | W |
| 3 | home | Houston | 79% | W |
| 4 | home | Sam Houston | 94% | W |
| 5 | away | Colorado | 70% | W |
| 7 | home | Arizona State | 81% | W |
| 8 | away | Cincinnati | 65% | W |
| 9 | home | Arizona | 76% | W |
| 10 | home | West Virginia | 89% | W |
| 11 | away | Oklahoma State | 86% | W |
| 12 | away | Baylor | 64% | W |
| 13 | home | TCU | 79% | W |
Two numbers come out of that table Picking every favorite is not the same as expecting to win every one. A 75 percent favorite loses one week in four, so the wins always add up to fewer than the picks.
Projected wins9.6
Games it would pick12–0
The Host, on what the model found Texas Tech is favored in all twelve games and its lowest number all year is 64 percent, at Baylor. It still projects 9.6 wins, because an 80 percent favorite drops one game in five. Tell me where that is wrong.
Run on the one shared calendar every team is also scored against, the same team projects 9.2.
How good the model thinks they are
WEAKESTMIDDLESTRONGEST
6th of 138 · 19.1 rating, and it is what the board is sorted by
How hard their schedule is
EASIESTMIDDLEHARDEST
74th of 138 · 4.6 against a field whose middle is 4.9
home games7
conference, which the model never readsACC
Every game: the chance the model gives this team, and the side it picks
| week | where | opponent | chance | call |
|---|
| 1 | away | Stanford | 76% | W |
| 2 | home | Florida A&M · not rated: no offseason to read | 98% | W |
| 3 | away | Wake Forest | 66% | W |
| 4 | home | Central Michigan | 88% | W |
| 5 | away | Clemson | 59% | W |
| 7 | home | Florida State | 82% | W |
| 8 | home | Pittsburgh | 79% | W |
| 9 | away | North Carolina | 74% | W |
| 10 | away | Notre Dame | 35% | L |
| 11 | home | Duke | 83% | W |
| 12 | home | Virginia Tech | 90% | W |
| 13 | home | Boston College | 91% | W |
Two numbers come out of that table Picking every favorite is not the same as expecting to win every one. A 75 percent favorite loses one week in four, so the wins always add up to fewer than the picks.
Projected wins9.2
Games it would pick11–1
The Host, on what the model found The model gives Miami 66 percent or better in ten of its twelve games. The two that are not: at Clemson, 59, and at Notre Dame, 35. Which of the two decides their season?
projected 7 of 138
Georgia
Run on the one shared calendar every team is also scored against, the same team projects 9.0.
How good the model thinks they are
WEAKESTMIDDLESTRONGEST
7th of 138 · 17.7 rating, and it is what the board is sorted by
How hard their schedule is
EASIESTMIDDLEHARDEST
19th of 138 · 8.4 against a field whose middle is 4.9
home games7
conference, which the model never readsSEC
Georgia returns most of last year's offense, worth 1.6 points of rating.
Every game: the chance the model gives this team, and the side it picks
| week | where | opponent | chance | call |
|---|
| 1 | home | Tennessee State · not rated: no offseason to read | 99% | W |
| 2 | home | Western Kentucky | 82% | W |
| 3 | away | Arkansas | 65% | W |
| 4 | home | Oklahoma | 67% | W |
| 5 | home | Vanderbilt | 69% | W |
| 6 | away | Alabama | 45% | L |
| 7 | home | Auburn | 80% | W |
| 9 | neutral | Florida | 68% | W |
| 10 | away | Ole Miss | 44% | L |
| 11 | home | Missouri | 73% | W |
| 12 | away | South Carolina | 55% | W |
| 13 | home | Georgia Tech | 79% | W |
Two numbers come out of that table Picking every favorite is not the same as expecting to win every one. A 75 percent favorite loses one week in four, so the wins always add up to fewer than the picks.
Projected wins8.3
Games it would pick10–2
The Host, on what the model found Georgia plays four road games and they are the four closest games on the card: Arkansas, Alabama, Ole Miss, South Carolina. The model still has them first in the SEC. Pick the one they drop.
projected 8 of 138
Texas A&M
Run on the one shared calendar every team is also scored against, the same team projects 8.8.
How good the model thinks they are
WEAKESTMIDDLESTRONGEST
8th of 138 · 16.7 rating, and it is what the board is sorted by
How hard their schedule is
EASIESTMIDDLEHARDEST
29th of 138 · 7.9 against a field whose middle is 4.9
home games7
conference, which the model never readsSEC
Texas A&M returns most of last year's offense, worth 1.4 points of rating.
Every game: the chance the model gives this team, and the side it picks
| week | where | opponent | chance | call |
|---|
| 1 | home | Missouri State | 88% | W |
| 2 | home | Arizona State | 77% | W |
| 3 | home | Kentucky | 85% | W |
| 4 | away | LSU | 57% | W |
| 5 | home | Arkansas | 83% | W |
| 6 | away | Missouri | 49% | L |
| 7 | home | The Citadel · not rated: no offseason to read | 97% | W |
| 8 | away | Alabama | 43% | L |
| 10 | away | South Carolina | 53% | W |
| 11 | home | Tennessee | 69% | W |
| 12 | away | Oklahoma | 41% | L |
| 13 | home | Texas | 66% | W |
Two numbers come out of that table Picking every favorite is not the same as expecting to win every one. A 75 percent favorite loses one week in four, so the wins always add up to fewer than the picks.
Projected wins8.1
Games it would pick9–3
The Host, on what the model found Texas A&M is one of only three teams in the top 25 where the model, the AP and the Coaches all land on the same number. All three say 8. Does agreement make you more confident, or less?
Run on the one shared calendar every team is also scored against, the same team projects 8.7.
How good the model thinks they are
WEAKESTMIDDLESTRONGEST
9th of 138 · 16.6 rating, and it is what the board is sorted by
How hard their schedule is
EASIESTMIDDLEHARDEST
45th of 138 · 6.8 against a field whose middle is 4.9
home games7
conference, which the model never readsBig 12
BYU returns most of last year's offense, worth 2.3 points of rating.
Every game: the chance the model gives this team, and the side it picks
| week | where | opponent | chance | call |
|---|
| 1 | home | Utah Tech · not rated: no offseason to read | 97% | W |
| 2 | home | Arizona | 72% | W |
| 3 | away | Colorado State | 78% | W |
| 5 | away | TCU | 53% | W |
| 6 | home | Iowa State | 81% | W |
| 7 | home | Notre Dame | 54% | W |
| 8 | away | UCF | 65% | W |
| 9 | home | Arizona State | 77% | W |
| 10 | away | Utah | 39% | L |
| 11 | home | Baylor | 79% | W |
| 12 | away | Kansas | 60% | W |
| 13 | home | Cincinnati | 81% | W |
Two numbers come out of that table Picking every favorite is not the same as expecting to win every one. A 75 percent favorite loses one week in four, so the wins always add up to fewer than the picks.
Projected wins8.4
Games it would pick11–1
The Host, on what the model found No team in the top 25 gained more from the offseason than BYU: returning production is worth 2.3 points to the projection. The model has them 9th, the AP has them 14th. Buying it?
Run on the one shared calendar every team is also scored against, the same team projects 8.7.
How good the model thinks they are
WEAKESTMIDDLESTRONGEST
10th of 138 · 16.4 rating, and it is what the board is sorted by
How hard their schedule is
EASIESTMIDDLEHARDEST
9th of 138 · 9.6 against a field whose middle is 4.9
home games7
conference, which the model never readsBig Ten
USC returns most of last year's offense, worth 1.1 points of rating.
Every game: the chance the model gives this team, and the side it picks
| week | where | opponent | chance | call |
|---|
| 1 | home | Fresno State | 83% | W |
| 1 | home | San José State | 90% | W |
| 2 | home | Louisiana | 84% | W |
| 3 | away | Rutgers | 62% | W |
| 4 | home | Oregon | 52% | W |
| 5 | home | Washington | 66% | W |
| 6 | away | Penn State | 51% | W |
| 8 | away | Wisconsin | 64% | W |
| 9 | home | Ohio State | 48% | L |
| 11 | away | Indiana | 29% | L |
| 12 | home | Maryland | 81% | W |
| 13 | away | UCLA | 67% | W |
Two numbers come out of that table Picking every favorite is not the same as expecting to win every one. A 75 percent favorite loses one week in four, so the wins always add up to fewer than the picks.
Projected wins7.8
Games it would pick10–2
The Host, on what the model found Three games on USC's card read 48, 51 and 52 percent: Ohio State at home, Penn State on the road, Oregon at home. Take two of the three and where does that put them?
Run on the one shared calendar every team is also scored against, the same team projects 8.6.
How good the model thinks they are
WEAKESTMIDDLESTRONGEST
11th of 138 · 16.0 rating, and it is what the board is sorted by
How hard their schedule is
EASIESTMIDDLEHARDEST
49th of 138 · 6.6 against a field whose middle is 4.9
home games7
conference, which the model never readsBig 12
Utah has a new head coach, costing it 1.5 points of rating.
Every game: the chance the model gives this team, and the side it picks
| week | where | opponent | chance | call |
|---|
| 1 | home | Idaho · not rated: no offseason to read | 94% | W |
| 2 | home | Arkansas | 82% | W |
| 3 | home | Utah State | 80% | W |
| 4 | away | Iowa State | 59% | W |
| 6 | home | Kansas | 80% | W |
| 7 | away | Colorado | 63% | W |
| 8 | home | Houston | 74% | W |
| 9 | away | Cincinnati | 59% | W |
| 10 | home | BYU | 61% | W |
| 11 | away | Arizona | 47% | L |
| 12 | away | TCU | 51% | W |
| 13 | home | West Virginia | 85% | W |
Two numbers come out of that table Picking every favorite is not the same as expecting to win every one. A 75 percent favorite loses one week in four, so the wins always add up to fewer than the picks.
Projected wins8.3
Games it would pick11–1
The Host, on what the model found Of the top 25 teams both human polls rank, Utah is the model's biggest argument: 11th here, 21st in both. That is after 1.5 points came off for a coaching change. Who is closer?
projected 12 of 138
Oklahoma
Run on the one shared calendar every team is also scored against, the same team projects 8.5.
How good the model thinks they are
WEAKESTMIDDLESTRONGEST
12th of 138 · 15.4 rating, and it is what the board is sorted by
How hard their schedule is
EASIESTMIDDLEHARDEST
6th of 138 · 9.9 against a field whose middle is 4.9
home games6
conference, which the model never readsSEC
Oklahoma returns most of last year's offense, worth 1.6 points of rating.
Every game: the chance the model gives this team, and the side it picks
| week | where | opponent | chance | call |
|---|
| 1 | home | UTEP | 91% | W |
| 2 | away | Michigan | 44% | L |
| 3 | home | New Mexico | 79% | W |
| 4 | away | Georgia | 33% | L |
| 6 | neutral | Texas | 51% | W |
| 7 | home | Kentucky | 83% | W |
| 8 | away | Mississippi State | 58% | W |
| 9 | home | South Carolina | 73% | W |
| 10 | away | Florida | 52% | W |
| 11 | home | Ole Miss | 64% | W |
| 12 | home | Texas A&M | 59% | W |
| 13 | away | Missouri | 46% | L |
Two numbers come out of that table Picking every favorite is not the same as expecting to win every one. A 75 percent favorite loses one week in four, so the wins always add up to fewer than the picks.
Projected wins7.3
Games it would pick9–3
The Host, on what the model found Half of Oklahoma's schedule is a coin flip. Six of the twelve games sit between 40 and 60 percent, the Red River game at 51 among them. Which of the six do you take?
Run on the one shared calendar every team is also scored against, the same team projects 8.4.
How good the model thinks they are
WEAKESTMIDDLESTRONGEST
13th of 138 · 15.0 rating, and it is what the board is sorted by
How hard their schedule is
EASIESTMIDDLEHARDEST
1st of 138 · 11.6 against a field whose middle is 4.9
home games7
conference, which the model never readsSEC
Texas returns most of last year's offense, worth 0.7 points of rating.
Every game: the chance the model gives this team, and the side it picks
| week | where | opponent | chance | call |
|---|
| 1 | home | Texas State | 74% | W |
| 2 | home | Ohio State | 45% | L |
| 3 | home | UTSA | 74% | W |
| 4 | away | Tennessee | 42% | L |
| 6 | neutral | Oklahoma | 49% | L |
| 7 | home | Florida | 74% | W |
| 8 | home | Ole Miss | 63% | W |
| 9 | home | Mississippi State | 79% | W |
| 10 | away | Missouri | 45% | L |
| 11 | away | LSU | 53% | W |
| 12 | home | Arkansas | 81% | W |
| 13 | away | Texas A&M | 34% | L |
Two numbers come out of that table Picking every favorite is not the same as expecting to win every one. A 75 percent favorite loses one week in four, so the wins always add up to fewer than the picks.
Projected wins7.1
Games it would pick7–5
The Host, on what the model found Texas has the hardest schedule of all 138 and projects 7.1 wins. The same roster on a median schedule projects 8.4. The AP says 5th, the model says 13th. Which schedule should a ranking price?
projected 14 of 138
Ole Miss
Run on the one shared calendar every team is also scored against, the same team projects 8.3.
How good the model thinks they are
WEAKESTMIDDLESTRONGEST
14th of 138 · 14.6 rating, and it is what the board is sorted by
How hard their schedule is
EASIESTMIDDLEHARDEST
15th of 138 · 8.7 against a field whose middle is 4.9
home games7
conference, which the model never readsSEC
Ole Miss has a new head coach, costing it 1.5 points of rating.
Every game: the chance the model gives this team, and the side it picks
| week | where | opponent | chance | call |
|---|
| 1 | neutral | Louisville | 57% | W |
| 2 | home | Charlotte | 91% | W |
| 3 | home | LSU | 75% | W |
| 4 | away | Florida | 50% | W |
| 6 | away | Vanderbilt | 38% | L |
| 7 | home | Missouri | 68% | W |
| 8 | away | Texas | 37% | L |
| 9 | home | Auburn | 75% | W |
| 10 | home | Georgia | 56% | W |
| 11 | away | Oklahoma | 36% | L |
| 12 | home | Wofford · not rated: no offseason to read | 94% | W |
| 13 | home | Mississippi State | 78% | W |
Two numbers come out of that table Picking every favorite is not the same as expecting to win every one. A 75 percent favorite loses one week in four, so the wins always add up to fewer than the picks.
Projected wins7.6
Games it would pick9–3
The Host, on what the model found Ole Miss plays four road games and the model's best number in any of them is 50 percent, at Florida. The other three read 38, 37 and 36. Where does that season finish?
projected 15 of 138
Alabama
Run on the one shared calendar every team is also scored against, the same team projects 8.3.
How good the model thinks they are
WEAKESTMIDDLESTRONGEST
15th of 138 · 14.6 rating, and it is what the board is sorted by
How hard their schedule is
EASIESTMIDDLEHARDEST
17th of 138 · 8.6 against a field whose middle is 4.9
home games7
conference, which the model never readsSEC
Alabama lost most of last year's offense, costing it 0.7 points of rating.
Every game: the chance the model gives this team, and the side it picks
| week | where | opponent | chance | call |
|---|
| 1 | home | East Carolina | 76% | W |
| 2 | away | Kentucky | 61% | W |
| 3 | home | Florida State | 74% | W |
| 4 | home | South Carolina | 71% | W |
| 5 | away | Mississippi State | 57% | W |
| 6 | home | Georgia | 55% | W |
| 7 | away | Tennessee | 41% | L |
| 8 | home | Texas A&M | 57% | W |
| 10 | away | LSU | 52% | W |
| 11 | away | Vanderbilt | 38% | L |
| 12 | home | Chattanooga · not rated: no offseason to read | 95% | W |
| 13 | home | Auburn | 75% | W |
Two numbers come out of that table Picking every favorite is not the same as expecting to win every one. A 75 percent favorite loses one week in four, so the wins always add up to fewer than the picks.
Projected wins7.5
Games it would pick10–2
The Host, on what the model found Alabama and Ole Miss carry the same projected rating to the tenth, 14.6, and the board separates them by one place. They do not meet this season. Which one is actually higher?
projected 16 of 138
Vanderbilt
Run on the one shared calendar every team is also scored against, the same team projects 8.3.
How good the model thinks they are
WEAKESTMIDDLESTRONGEST
16th of 138 · 14.4 rating, and it is what the board is sorted by
How hard their schedule is
EASIESTMIDDLEHARDEST
20th of 138 · 8.4 against a field whose middle is 4.9
home games7
conference, which the model never readsSEC
Vanderbilt lost most of last year's offense, costing it 0.6 points of rating.
Every game: the chance the model gives this team, and the side it picks
| week | where | opponent | chance | call |
|---|
| 1 | home | Austin Peay · not rated: no offseason to read | 90% | W |
| 2 | home | Delaware | 82% | W |
| 3 | home | NC State | 72% | W |
| 4 | away | Auburn | 52% | W |
| 5 | away | Georgia | 31% | L |
| 6 | home | Ole Miss | 62% | W |
| 7 | home | Arkansas | 80% | W |
| 8 | away | Kentucky | 61% | W |
| 10 | away | Mississippi State | 56% | W |
| 11 | home | Alabama | 62% | W |
| 12 | away | Florida | 50% | L |
| 13 | home | Tennessee | 65% | W |
Two numbers come out of that table Picking every favorite is not the same as expecting to win every one. A 75 percent favorite loses one week in four, so the wins always add up to fewer than the picks.
Projected wins7.6
Games it would pick10–2
The Host, on what the model found Vanderbilt is 16th here and unranked by both human polls. The model puts them above Washington, Tennessee and Michigan without reading a single vote. Somebody is wrong. Who?
projected 17 of 138
Washington
Run on the one shared calendar every team is also scored against, the same team projects 8.3.
How good the model thinks they are
WEAKESTMIDDLESTRONGEST
17th of 138 · 14.4 rating, and it is what the board is sorted by
How hard their schedule is
EASIESTMIDDLEHARDEST
13th of 138 · 9.0 against a field whose middle is 4.9
home games7
conference, which the model never readsBig Ten
Washington returns most of last year's offense, worth 0.7 points of rating.
Every game: the chance the model gives this team, and the side it picks
| week | where | opponent | chance | call |
|---|
| 1 | home | Washington State | 70% | W |
| 2 | home | Utah State | 78% | W |
| 3 | home | Eastern Washington · not rated: no offseason to read | 94% | W |
| 4 | home | Minnesota | 75% | W |
| 5 | away | USC | 34% | L |
| 6 | home | Iowa | 66% | W |
| 7 | away | Purdue | 65% | W |
| 9 | away | Nebraska | 55% | W |
| 10 | home | Penn State | 70% | W |
| 11 | away | Michigan State | 64% | W |
| 12 | home | Indiana | 48% | L |
| 13 | away | Oregon | 25% | L |
Two numbers come out of that table Picking every favorite is not the same as expecting to win every one. A 75 percent favorite loses one week in four, so the wins always add up to fewer than the picks.
Projected wins7.4
Games it would pick9–3
The Host, on what the model found The only home game the model does not favor Washington in is Indiana, 48 percent. Oregon and USC both come on the road. Read the schedule column and tell me where the losses are.
Run on the one shared calendar every team is also scored against, the same team projects 8.1.
How good the model thinks they are
WEAKESTMIDDLESTRONGEST
18th of 138 · 13.5 rating, and it is what the board is sorted by
How hard their schedule is
EASIESTMIDDLEHARDEST
66th of 138 · 5.2 against a field whose middle is 4.9
home games7
conference, which the model never readsACC
SMU returns most of last year's offense, worth 0.7 points of rating.
Every game: the chance the model gives this team, and the side it picks
| week | where | opponent | chance | call |
|---|
| 1 | away | Florida State | 49% | L |
| 2 | home | UC Davis · not rated: no offseason to read | 87% | W |
| 3 | away | Louisville | 42% | L |
| 4 | home | Missouri State | 84% | W |
| 5 | home | Boston College | 85% | W |
| 7 | home | Virginia | 71% | W |
| 8 | home | California | 79% | W |
| 9 | away | Syracuse | 65% | W |
| 10 | home | Virginia Tech | 84% | W |
| 11 | home | Wake Forest | 76% | W |
| 12 | away | Notre Dame | 24% | L |
| 13 | away | Stanford | 66% | W |
Two numbers come out of that table Picking every favorite is not the same as expecting to win every one. A 75 percent favorite loses one week in four, so the wins always add up to fewer than the picks.
Projected wins8.1
Games it would pick9–3
The Host, on what the model found The model calls SMU 9-3 and puts two of the three losses in the first three weeks, both away: Florida State at 49 percent and Louisville at 42. Start 1-2 and is anybody still buying 18th?
projected 19 of 138
Tennessee
Run on the one shared calendar every team is also scored against, the same team projects 8.0.
How good the model thinks they are
WEAKESTMIDDLESTRONGEST
19th of 138 · 13.1 rating, and it is what the board is sorted by
How hard their schedule is
EASIESTMIDDLEHARDEST
31st of 138 · 7.8 against a field whose middle is 4.9
home games7
conference, which the model never readsSEC
Every game: the chance the model gives this team, and the side it picks
| week | where | opponent | chance | call |
|---|
| 1 | home | Furman · not rated: no offseason to read | 95% | W |
| 2 | away | Georgia Tech | 48% | L |
| 3 | home | Kennesaw State | 82% | W |
| 4 | home | Texas | 58% | W |
| 5 | home | Auburn | 72% | W |
| 6 | away | Arkansas | 56% | W |
| 7 | home | Alabama | 59% | W |
| 8 | away | South Carolina | 45% | L |
| 10 | home | Kentucky | 79% | W |
| 11 | away | Texas A&M | 31% | L |
| 12 | home | LSU | 72% | W |
| 13 | away | Vanderbilt | 35% | L |
Two numbers come out of that table Picking every favorite is not the same as expecting to win every one. A 75 percent favorite loses one week in four, so the wins always add up to fewer than the picks.
Projected wins7.3
Games it would pick8–4
The Host, on what the model found The model calls every Tennessee home game a win and four of the five road games losses. The whole 8-4 is about where the bus goes. Give me one they steal.
Run on the one shared calendar every team is also scored against, the same team projects 7.9.
How good the model thinks they are
WEAKESTMIDDLESTRONGEST
20th of 138 · 12.6 rating, and it is what the board is sorted by
How hard their schedule is
EASIESTMIDDLEHARDEST
42nd of 138 · 6.9 against a field whose middle is 4.9
home games7
conference, which the model never readsBig Ten
Every game: the chance the model gives this team, and the side it picks
| week | where | opponent | chance | call |
|---|
| 1 | home | Northern Illinois | 88% | W |
| 2 | home | Iowa State | 74% | W |
| 3 | home | Northern Iowa · not rated: no offseason to read | 94% | W |
| 4 | away | Michigan | 38% | L |
| 5 | home | Ohio State | 40% | L |
| 6 | away | Washington | 34% | L |
| 8 | away | Minnesota | 48% | L |
| 9 | home | Wisconsin | 78% | W |
| 10 | away | Northwestern | 48% | L |
| 11 | home | Purdue | 82% | W |
| 12 | away | Illinois | 43% | L |
| 13 | home | Nebraska | 74% | W |
Two numbers come out of that table Picking every favorite is not the same as expecting to win every one. A 75 percent favorite loses one week in four, so the wins always add up to fewer than the picks.
Projected wins7.4
Games it would pick6–6
The Host, on what the model found Nobody in the model's top 25 is favored in fewer games than Iowa, six of twelve, and three of the other six read 43 percent or better. Is 20th too kind?
projected 21 of 138
Michigan
Run on the one shared calendar every team is also scored against, the same team projects 7.9.
How good the model thinks they are
WEAKESTMIDDLESTRONGEST
21st of 138 · 12.6 rating, and it is what the board is sorted by
How hard their schedule is
EASIESTMIDDLEHARDEST
2nd of 138 · 10.6 against a field whose middle is 4.9
home games8
conference, which the model never readsBig Ten
Michigan has a new head coach, costing it 1.5 points of rating.
Every game: the chance the model gives this team, and the side it picks
| week | where | opponent | chance | call |
|---|
| 1 | home | Western Michigan | 67% | W |
| 2 | home | Oklahoma | 56% | W |
| 3 | home | UTEP | 89% | W |
| 4 | home | Iowa | 62% | W |
| 5 | away | Minnesota | 48% | L |
| 7 | home | Penn State | 67% | W |
| 8 | home | Indiana | 44% | L |
| 9 | away | Rutgers | 54% | W |
| 10 | home | Michigan State | 81% | W |
| 11 | away | Oregon | 22% | L |
| 12 | home | UCLA | 80% | W |
| 13 | away | Ohio State | 19% | L |
Two numbers come out of that table Picking every favorite is not the same as expecting to win every one. A 75 percent favorite loses one week in four, so the wins always add up to fewer than the picks.
Projected wins6.9
Games it would pick8–4
The Host, on what the model found Michigan takes two hits at once: 1.5 points off for a coaching change the model knows only as a change, and the second hardest schedule of 138. On a median slate this roster wins 7.9. Which hit is bigger?
projected 22 of 138
Boise State
Run on the one shared calendar every team is also scored against, the same team projects 7.8.
How good the model thinks they are
WEAKESTMIDDLESTRONGEST
22nd of 138 · 12.1 rating, and it is what the board is sorted by
How hard their schedule is
EASIESTMIDDLEHARDEST
46th of 138 · 6.7 against a field whose middle is 4.9
home games6
conference, which the model never readsPac-12
Boise State returns most of last year's offense, worth 1.5 points of rating.
Every game: the chance the model gives this team, and the side it picks
| week | where | opponent | chance | call |
|---|
| 1 | away | Oregon | 21% | L |
| 2 | home | Memphis | 74% | W |
| 3 | home | South Dakota · not rated: no offseason to read | 85% | W |
| 4 | away | Western Michigan | 43% | L |
| 5 | home | Utah State | 74% | W |
| 6 | away | Fresno State | 54% | W |
| 8 | away | Washington State | 41% | L |
| 9 | home | Texas State | 69% | W |
| 10 | away | Colorado State | 70% | W |
| 11 | home | Oregon State | 84% | W |
| 12 | home | San Diego State | 64% | W |
Two numbers come out of that table Picking every favorite is not the same as expecting to win every one. A 75 percent favorite loses one week in four, so the wins always add up to fewer than the picks.
Projected wins6.8
Games it would pick8–3
The Host, on what the model found Boise State is the best team the model rates outside the four power leagues, and it opens at Oregon, 21 percent, the hardest game on its card. Eleven games, not twelve. Does week one define them?
projected 23 of 138
Missouri
Run on the one shared calendar every team is also scored against, the same team projects 7.7.
How good the model thinks they are
WEAKESTMIDDLESTRONGEST
23rd of 138 · 11.9 rating, and it is what the board is sorted by
How hard their schedule is
EASIESTMIDDLEHARDEST
22nd of 138 · 8.2 against a field whose middle is 4.9
home games7
conference, which the model never readsSEC
Every game: the chance the model gives this team, and the side it picks
| week | where | opponent | chance | call |
|---|
| 1 | home | Arkansas-Pine Bluff · not rated: no offseason to read | 96% | W |
| 2 | away | Kansas | 50% | L |
| 3 | home | Troy | 77% | W |
| 4 | away | Mississippi State | 51% | W |
| 5 | home | Florida | 68% | W |
| 6 | home | Texas A&M | 51% | W |
| 7 | away | Ole Miss | 32% | L |
| 9 | away | Arkansas | 53% | W |
| 10 | home | Texas | 55% | W |
| 11 | away | Georgia | 27% | L |
| 12 | home | Kentucky | 77% | W |
| 13 | home | Oklahoma | 54% | W |
Two numbers come out of that table Picking every favorite is not the same as expecting to win every one. A 75 percent favorite loses one week in four, so the wins always add up to fewer than the picks.
Projected wins6.9
Games it would pick9–3
The Host, on what the model found Six of Missouri's twelve games are priced between 50 and 55 percent. The model picks a side in all six and expects to lose nearly half of them anyway. Would you take the over on 6.9 wins?
projected 24 of 138
Arizona
Run on the one shared calendar every team is also scored against, the same team projects 7.7.
How good the model thinks they are
WEAKESTMIDDLESTRONGEST
24th of 138 · 11.8 rating, and it is what the board is sorted by
How hard their schedule is
EASIESTMIDDLEHARDEST
25th of 138 · 8.1 against a field whose middle is 4.9
home games7
conference, which the model never readsBig 12
Arizona returns most of last year's offense, worth 1.3 points of rating.
Every game: the chance the model gives this team, and the side it picks
| week | where | opponent | chance | call |
|---|
| 1 | home | Northern Arizona · not rated: no offseason to read | 91% | W |
| 2 | away | BYU | 28% | L |
| 3 | home | Northern Illinois | 87% | W |
| 4 | away | Washington State | 41% | L |
| 5 | home | Cincinnati | 72% | W |
| 6 | away | West Virginia | 58% | W |
| 8 | home | Iowa State | 72% | W |
| 9 | away | Texas Tech | 24% | L |
| 10 | home | TCU | 66% | W |
| 11 | home | Utah | 53% | W |
| 12 | away | Kansas State | 40% | L |
| 13 | home | Arizona State | 68% | W |
Two numbers come out of that table Picking every favorite is not the same as expecting to win every one. A 75 percent favorite loses one week in four, so the wins always add up to fewer than the picks.
Projected wins7.0
Games it would pick8–4
The Host, on what the model found Every loss the model gives Arizona is a road game, and it calls all seven home games wins. Neither human poll ranks them at all. Who is closer to right?
projected 25 of 138
Louisville
Run on the one shared calendar every team is also scored against, the same team projects 7.7.
How good the model thinks they are
WEAKESTMIDDLESTRONGEST
25th of 138 · 11.6 rating, and it is what the board is sorted by
How hard their schedule is
EASIESTMIDDLEHARDEST
53rd of 138 · 6.4 against a field whose middle is 4.9
home games6
conference, which the model never readsACC
Louisville lost most of last year's offense, costing it 0.9 points of rating.
Every game: the chance the model gives this team, and the side it picks
| week | where | opponent | chance | call |
|---|
| 1 | neutral | Ole Miss | 43% | L |
| 2 | home | Villanova · not rated: no offseason to read | 84% | W |
| 3 | home | SMU | 58% | W |
| 4 | home | Wake Forest | 73% | W |
| 5 | away | NC State | 43% | L |
| 6 | home | Florida State | 69% | W |
| 7 | away | Syracuse | 61% | W |
| 9 | home | Stanford | 82% | W |
| 10 | away | Georgia Tech | 45% | L |
| 11 | away | North Carolina | 59% | W |
| 12 | home | Pittsburgh | 65% | W |
| 13 | away | Kentucky | 55% | W |
Two numbers come out of that table Picking every favorite is not the same as expecting to win every one. A 75 percent favorite loses one week in four, so the wins always add up to fewer than the picks.
Projected wins7.4
Games it would pick9–3
The Host, on what the model found The AP has Louisville 24th and the Coaches poll leaves them off. The model lands on 25 and hands them six games between 43 and 59 percent. Ranked or not ranked?
projected 83 of 138
South Alabama
Run on the one shared calendar every team is also scored against, the same team projects 6.0.
How good the model thinks they are
WEAKESTMIDDLESTRONGEST
83rd of 138 · 4.3 rating, and it is what the board is sorted by
How hard their schedule is
EASIESTMIDDLEHARDEST
97th of 138 · 3.0 against a field whose middle is 4.9
home games6
conference, which the model never readsSun Belt
South Alabama returns most of last year's offense, worth 1.7 points of rating.
Every game: the chance the model gives this team, and the side it picks
| week | where | opponent | chance | call |
|---|
| 1 | home | SE Louisiana · not rated: no offseason to read | 78% | W |
| 2 | away | Tulane | 33% | L |
| 3 | home | Ohio | 57% | W |
| 4 | away | Kentucky | 39% | L |
| 5 | home | UL Monroe | 75% | W |
| 6 | away | Arkansas State | 45% | L |
| 8 | away | Marshall | 33% | L |
| 9 | home | Louisiana Tech | 60% | W |
| 10 | away | Louisiana | 39% | L |
| 11 | home | Troy | 62% | W |
| 12 | away | Southern Miss | 41% | L |
| 13 | home | App State | 68% | W |
Two numbers come out of that table Picking every favorite is not the same as expecting to win every one. A 75 percent favorite loses one week in four, so the wins always add up to fewer than the picks.
Projected wins6.3
Games it would pick6–6