
2025 season · through week 16
Nobody voted on this.
Ranked by how hard each record was to get against the schedule that produced it. No preseason poll, no reputation, no conference name.
- 1Indiana13-01 in 1,736key 3.24
- 2Oregon11-11 in 92key 1.96
- 3Georgia12-11 in 86key 1.93
- 4Ohio State12-11 in 82key 1.91
- 5Texas A&M11-11 in 68key 1.83
- 6BYU11-21 in 45key 1.66
- 7Texas Tech12-11 in 45key 1.65
- 8Ole Miss11-11 in 28key 1.44
- 9Oklahoma10-21 in 16key 1.19
- 10Alabama10-31 in 11key 1.04
- 11Notre Dame10-21 in 10key 0.98
- 12Miami10-21 in 8key 0.92
- 13Vanderbilt10-21 in 8key 0.91
- 14James Madison12-11 in 7key 0.86
- 15Texas9-31 in 7key 0.84
- 16Utah10-21 in 7key 0.83
- 17Navy10-21 in 6key 0.75
- 18Tulane11-21 in 5key 0.73
- 19Michigan9-31 in 4key 0.59
- 20USC9-31 in 4key 0.56
- 21North Texas11-21 in 4key 0.56
- 22South Florida9-31 in 3key 0.44
- 23Arizona9-31 in 2key 0.35
- 24Virginia10-31 in 2key 0.32
- 25Arizona State8-41 in 2key 0.31
Take week 16 with you.
The board as it stood that week, drawn for a timeline.
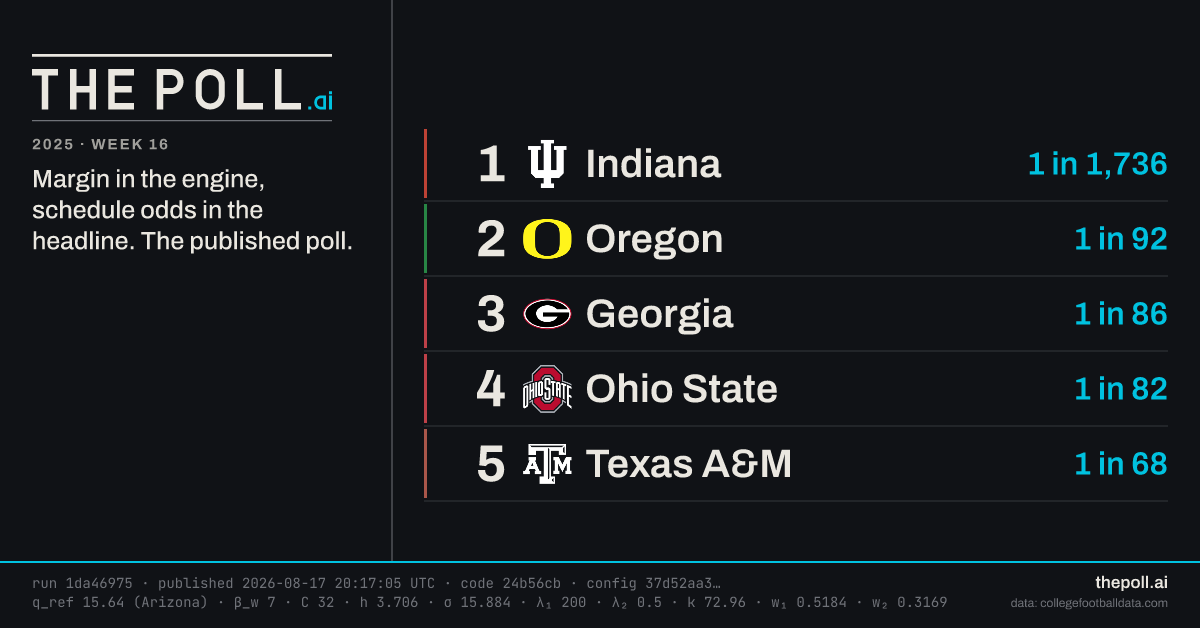
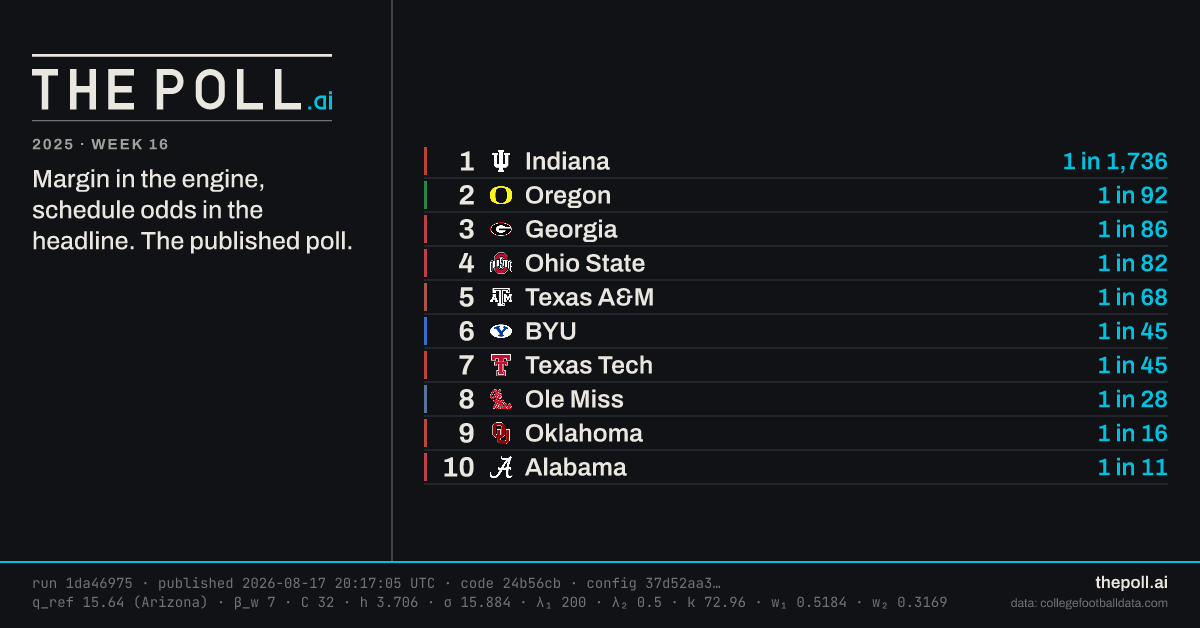
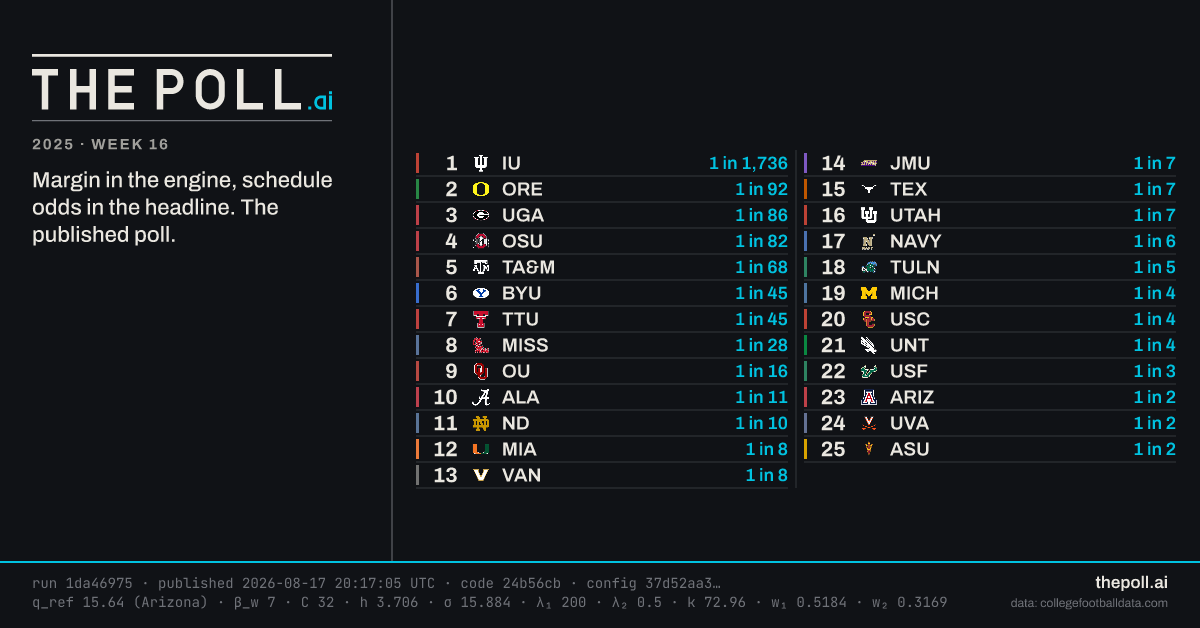
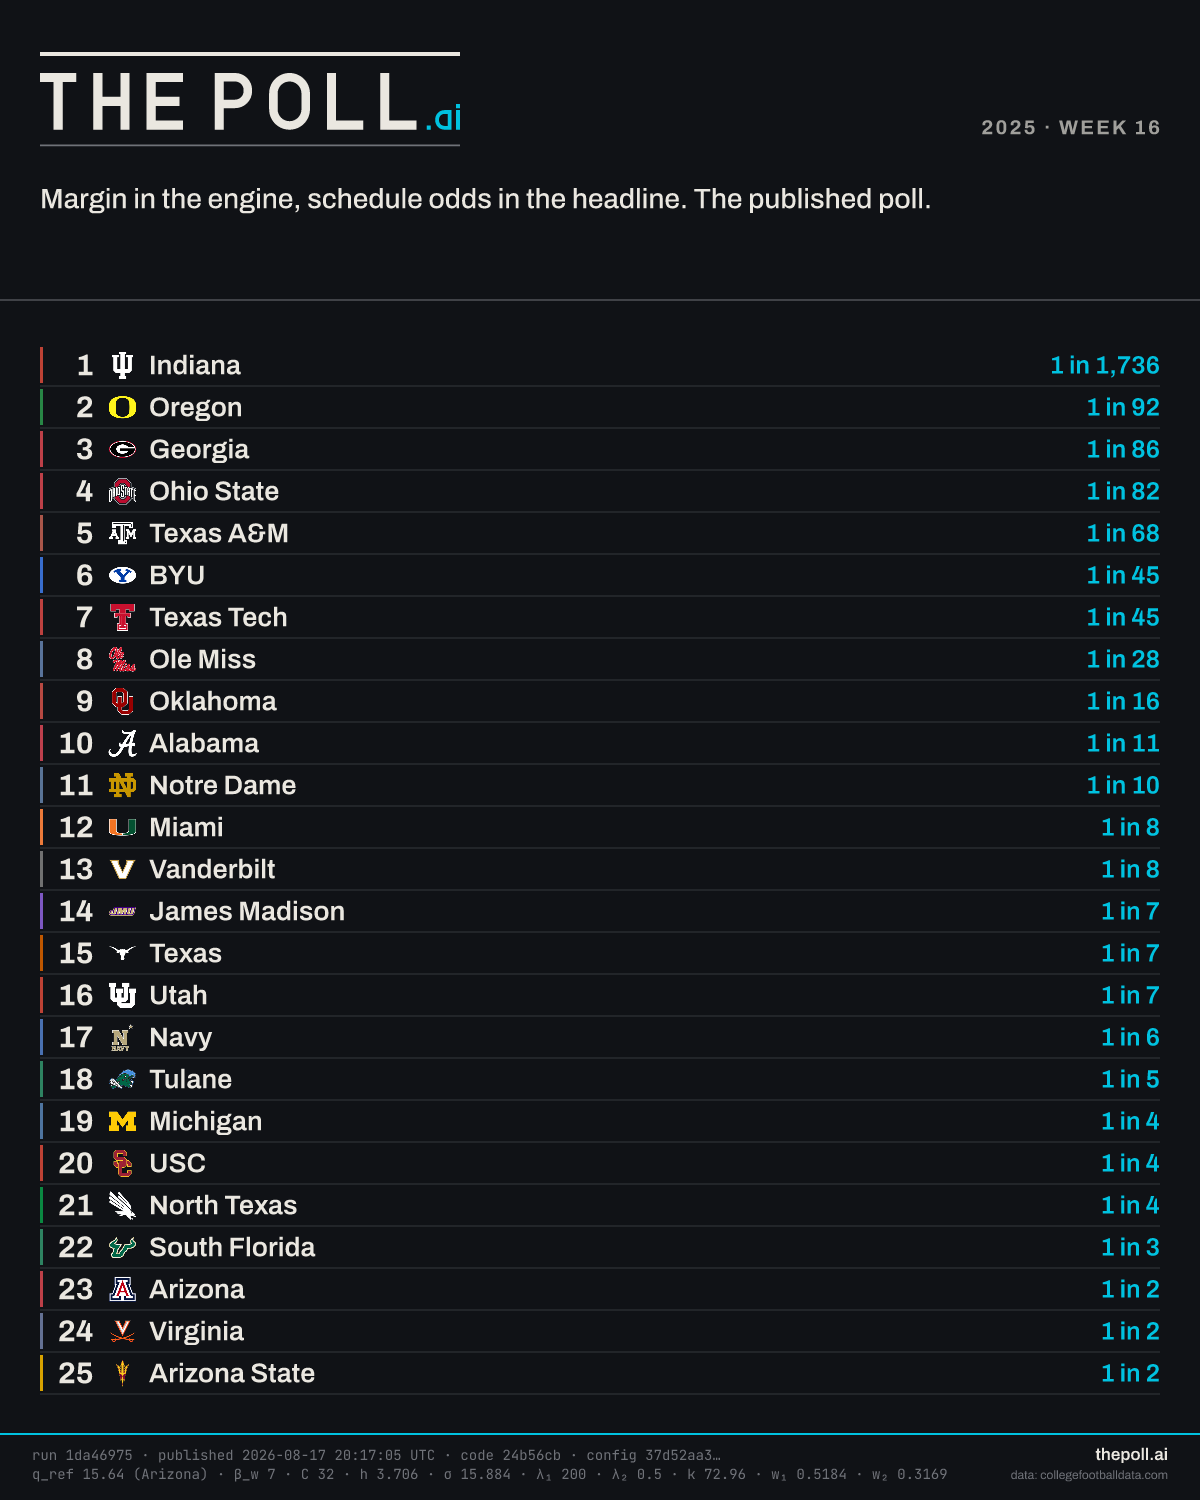
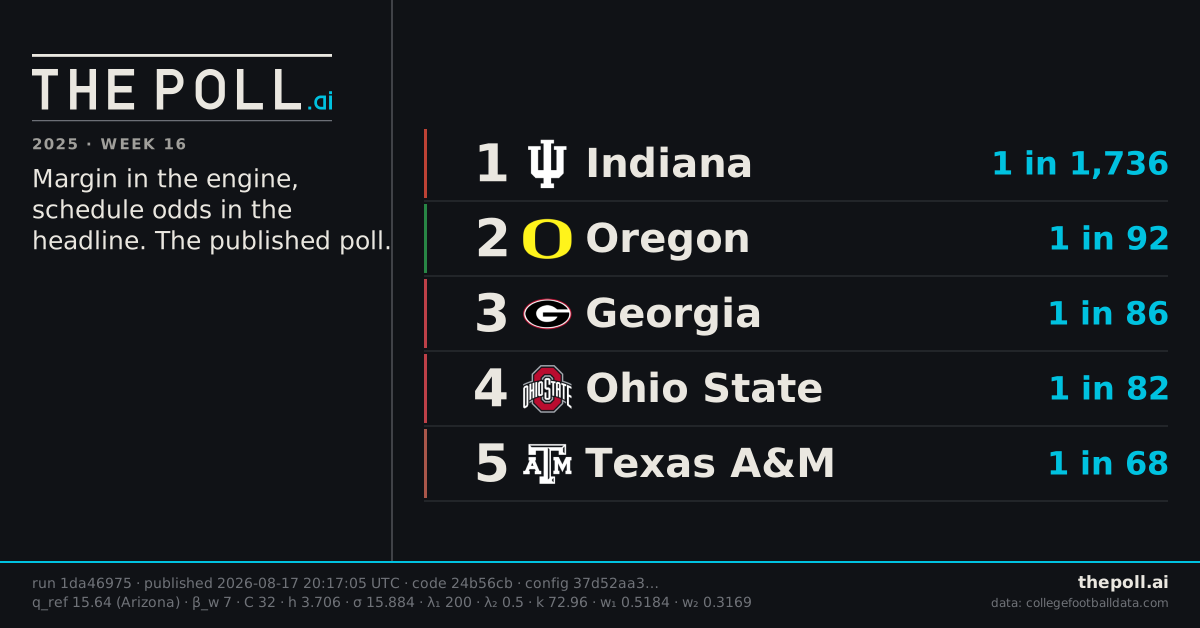
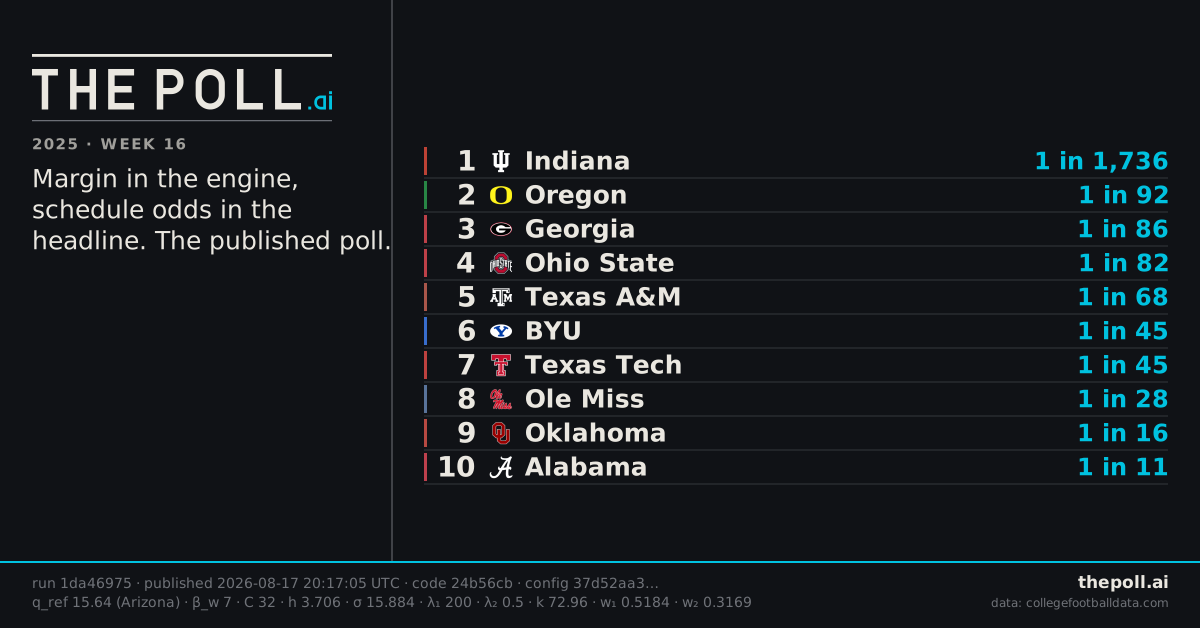
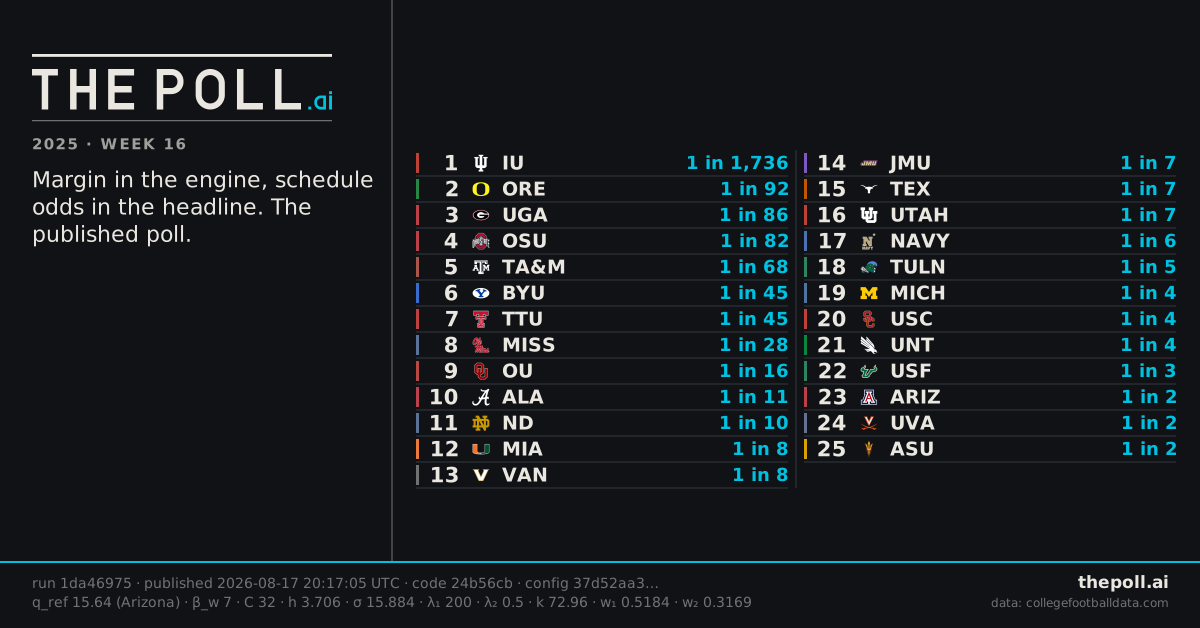
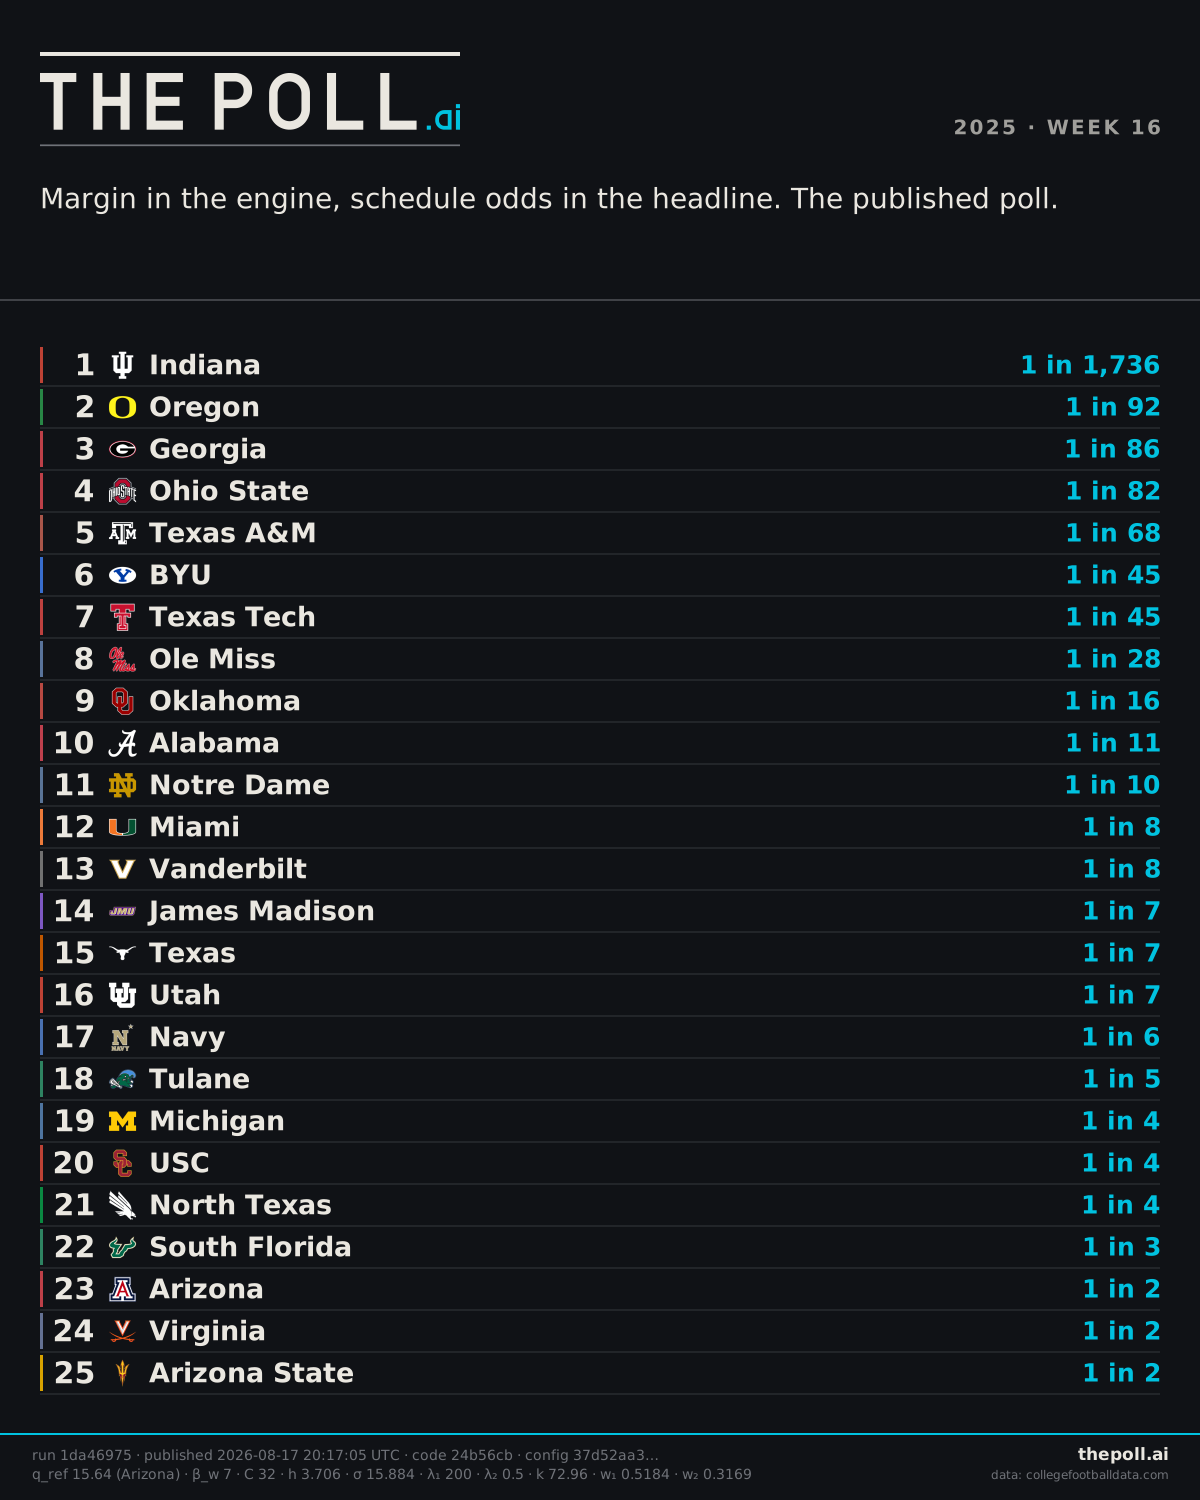
The right-hand number is how hard that season was to pull off against that exact schedule. One in 1,736 put Indiana on top. One in 2 was enough for 25th. Below about 1 in 5 it stops separating teams, which is what the smaller key underneath is for. The bar under each name is where the model kept landing that team out of 136, every bar on one scale. A typical bar this week spans 75 places.
2025 week 16 · 61a5fd2c · code e215160 · The House Poll · method 061a6d4e · 136 teams ranked
Every column
The board above is the thirty-second version. Below it is everything the run published: the résumé, the power rating, the gap, the rank interval, and where the finished season puts each team.
Every figure the cards carry, for the 25 on the board, with nothing to click.
| # | team | record | how unlikely1 in this many | expectedwins this schedule asked for | beat that by | powerrating (rank) | gapplaces from the poll | rangein 90% of replays | hindsight |
|---|---|---|---|---|---|---|---|---|---|
| 1 | Indiana | 13-0 | 1 in 1,736 | 8.2 | +4.8 | 30.0 (2) | +30.0 | 1 to 24 | 0.0 |
| 2 | Oregon | 11-1 | 1 in 92 | 7.3 | +3.7 | 26.2 (5) | +10.8 | 1 to 35 | 0.0 |
| 3 | Georgia | 12-1 | 1 in 86 | 8.0 | +4.0 | 22.6 (10) | +13.0 | 2 to 44 | -1.0 |
| 4 | Ohio State | 12-1 | 1 in 82 | 8.3 | +3.7 | 29.4 (3) | +7.3 | 1 to 24 | +1.0 |
| 5 | Texas A&M | 11-1 | 1 in 68 | 7.4 | +3.6 | 22.7 (9) | +13.8 | 2 to 44 | 0.0 |
| 6 | BYU | 11-2 | 1 in 45 | 7.6 | +3.4 | 19.7 (15) | +12.9 | 4 to 62 | -1.0 |
| 7 | Texas Tech | 12-1 | 1 in 45 | 8.7 | +3.3 | 31.0 (1) | +4.4 | 1 to 22 | +1.0 |
| 8 | Ole Miss | 11-1 | 1 in 28 | 8.0 | +3.0 | 17.8 (19) | +15.9 | 5 to 68 | 0.0 |
| 9 | Oklahoma | 10-2 | 1 in 16 | 7.1 | +2.9 | 20.2 (13) | +8.2 | 3 to 51 | 0.0 |
| 10 | Alabama | 10-3 | 1 in 11 | 7.4 | +2.6 | 20.1 (14) | +6.1 | 3 to 58 | 0.0 |
| 11 | Notre Dame | 10-2 | 1 in 10 | 7.6 | +2.4 | 28.0 (4) | -0.8 | 1 to 29 | 0.0 |
| 12 | Miami | 10-2 | 1 in 8 | 7.8 | +2.2 | 24.4 (7) | +2.3 | 2 to 42 | 0.0 |
| 13 | Vanderbilt | 10-2 | 1 in 8 | 7.8 | +2.2 | 23.0 (8) | +3.7 | 2 to 44 | 0.0 |
| 14 | James Madison | 12-1 | 1 in 7 | 10.0 | +2.0 | 18.7 (17) | +9.5 | 3 to 57 | 0.0 |
| 15 | Texas | 9-3 | 1 in 7 | 7.0 | +2.0 | 17.2 (22) | +8.2 | 6 to 71 | 0.0 |
| 16 | Utah | 10-2 | 1 in 7 | 8.0 | +2.0 | 24.5 (6) | +1.4 | 2 to 39 | 0.0 |
| 17 | Navy | 10-2 | 1 in 6 | 8.3 | +1.7 | 11.2 (46) | +14.8 | 16 to 94 | -1.0 |
| 18 | Tulane | 11-2 | 1 in 5 | 9.1 | +1.9 | 10.9 (48) | +13.7 | 17 to 99 | +1.0 |
| 19 | Michigan | 9-3 | 1 in 4 | 7.5 | +1.5 | 17.5 (20) | +5.0 | 6 to 74 | -1.0 |
| 20 | USC | 9-3 | 1 in 4 | 7.6 | +1.4 | 21.2 (11) | +1.2 | 3 to 58 | +1.0 |
| 21 | North Texas | 11-2 | 1 in 4 | 9.6 | +1.4 | 19.4 (16) | +3.0 | 4 to 55 | 0.0 |
| 22 | South Florida | 9-3 | 1 in 3 | 8.0 | +1.0 | 20.4 (12) | +0.2 | 3 to 51 | 0.0 |
| 23 | Arizona | 9-3 | 1 in 2 | 8.3 | +0.7 | 15.6 (25) | +3.3 | 8 to 74 | -2.0 |
| 24 | Virginia | 10-3 | 1 in 2 | 9.3 | +0.7 | 15.5 (26) | +2.9 | 7 to 73 | 0.0 |
| 25 | Arizona State | 8-4 | 1 in 2 | 7.4 | +0.6 | 11.8 (44) | +6.3 | 13 to 94 | -2.0 |
Show the full table: top 25 of 136, every columnthe published poll
| # | teamunderline: 90% rank interval · league median width 75 | how unlikely1 in this many |
|---|---|---|
| 1 | IndianaBig Ten | 3.2401 in 1,736 |
| 2 | OregonBig Ten | 1.9631 in 92 |
| 3 | GeorgiaSEC | 1.9321 in 86 |
| 4 | Ohio StateBig Ten | 1.9141 in 82 |
| 5 | Texas A&MSEC | 1.8351 in 68 |
| 6 | BYUBig 12 | 1.6571 in 45 |
| 7 | Texas TechBig 12 | 1.6511 in 45 |
| 8 | Ole MissSEC | 1.4431 in 28 |
| 9 | OklahomaSEC | 1.1951 in 16 |
| 10 | AlabamaSEC | 1.0401 in 11 |
| 11 | Notre DameFBS Independents | 0.9791 in 10 |
| 12 | MiamiACC | 0.9191 in 8 |
| 13 | VanderbiltSEC | 0.9141 in 8 |
| 14 | James MadisonSun Belt | 0.8641 in 7 |
| 15 | TexasSEC | 0.8351 in 7 |
| 16 | UtahBig 12 | 0.8281 in 7 |
| 17 | NavyAmerican Athletic | 0.7461 in 6 |
| 18 | TulaneAmerican Athletic | 0.7331 in 5 |
| 19 | MichiganBig Ten | 0.5931 in 4 |
| 20 | USCBig Ten | 0.5651 in 4 |
| 21 | North TexasAmerican Athletic | 0.5561 in 4 |
| 22 | South FloridaAmerican Athletic | 0.4361 in 3 |
| 23 | ArizonaBig 12 | 0.3491 in 2 |
| 24 | VirginiaACC | 0.3231 in 2 |
| 25 | Arizona StateBig 12 | 0.3121 in 2 |
What this board believes football results are for
The House Poll, in its own words
This is the poll this project publishes and this recipe changes nothing about it. Margin counts, and it counts less and less as it grows: the response is C*tanh(m/C) with C at 32 points plus a 7 point win premium, so the gap between a 3 point win and a 24 point win is large and the gap between a 45 point win and a 70 point win is almost nothing. There is no cliff anywhere for a coach to aim at, which is what tanh buys over a hard cap. Then the headline does not read margin at all. Teams are ordered by schedule odds, the probability that a team of published reference quality would have gone at least this well against this exact schedule, and the harder it was to do what you did the higher you go. Margin is in the engine because it carries real information about how good a team is. It is out of the headline because the headline is about what a team earned, and those are two different questions that deserve two different columns.
what it costs
- An unbeaten team can finish behind a one loss team, and that will need explaining every single year. It is the direct consequence of the promise. The explanation is on the page: the tail probability, the reference team it was measured against by name, and the Power column beside it.
- One published constant the wins based resume did not need. q_ref is the Power rating of the 25th ranked team that week, the least flattering defensible reading of ESPN's average Top-25 team. The study measured the ordering across a 16 point swing in it: Kendall's tau never fell below 0.985 and at most one team entered or left the top 25.
- It loses forward ordering accuracy to Full Merit by about two points. Accepted, and for a stated reason: forward accuracy is a prediction metric and the headline poll is not the instrument this project ships for prediction. L3 Power is, and it beats all three orderings on that axis.
- It is a compromise and it will satisfy neither end of the argument completely. Someone who believes margin is the only honest measurement will find the compression arbitrary, and someone who believes point differential should never pay will find 32 points of it far too generous. Both are reading the position correctly.
what it changed
Nothing at all. This is the poll this project publishes and this recipe changes none of it.
configs/recipes/house.toml
same evidence, different valuesEvery board on this page was fitted on the same 1,637 games, and the digest of that exact frame is 26f45004e64c under all three. Switching lens changes the constants above and nothing else. Method digest for this one: 061a6d4eda23.
Where next
- Tune it yourself Move one setting and watch the board move.
- The revision What this week looked like once the season ended.
- Connectivity How much of the field was comparable, and what held it together.
- Methodology Every constant, every baseline, and the lines that say FAIL.