
2025 season · through week 16
Nobody voted on this.
Ranked by how hard each record was to get against the schedule that produced it. No preseason poll, no reputation, no conference name.
- 1Indiana13-01 in 1,232key 3.09
- 2Oregon11-11 in 74key 1.87
- 3Ohio State12-11 in 68key 1.83
- 4Texas A&M11-11 in 54key 1.74
- 5Georgia12-11 in 80key 1.90
- 6Texas Tech12-11 in 41key 1.61
- 7Ole Miss11-11 in 24key 1.39
- 8BYU11-21 in 38key 1.58
- 9James Madisonpoll has it 1412-11 in 9key 0.95
- 10Oklahoma10-21 in 15key 1.17
- 11Notre Dame10-21 in 9key 0.95
- 12Vanderbilt10-21 in 7key 0.87
- 13Navy10-21 in 6key 0.78
- 14Miami10-21 in 7key 0.87
- 15Alabamapoll has it 1010-31 in 10key 0.98
- 16Utah10-21 in 6key 0.80
- 17Texas9-31 in 6key 0.80
- 18Tulane11-21 in 6key 0.75
- 19North Texas11-21 in 4key 0.63
- 20Michigan9-31 in 4key 0.56
- 21USC9-31 in 3key 0.53
- 22South Florida9-31 in 3key 0.48
- 23Arizona9-31 in 2key 0.34
- 24Virginia10-31 in 2key 0.33
- 25Houston9-31 in 2key 0.31
Take week 16 with you.
The board as it stood that week, drawn for a timeline.
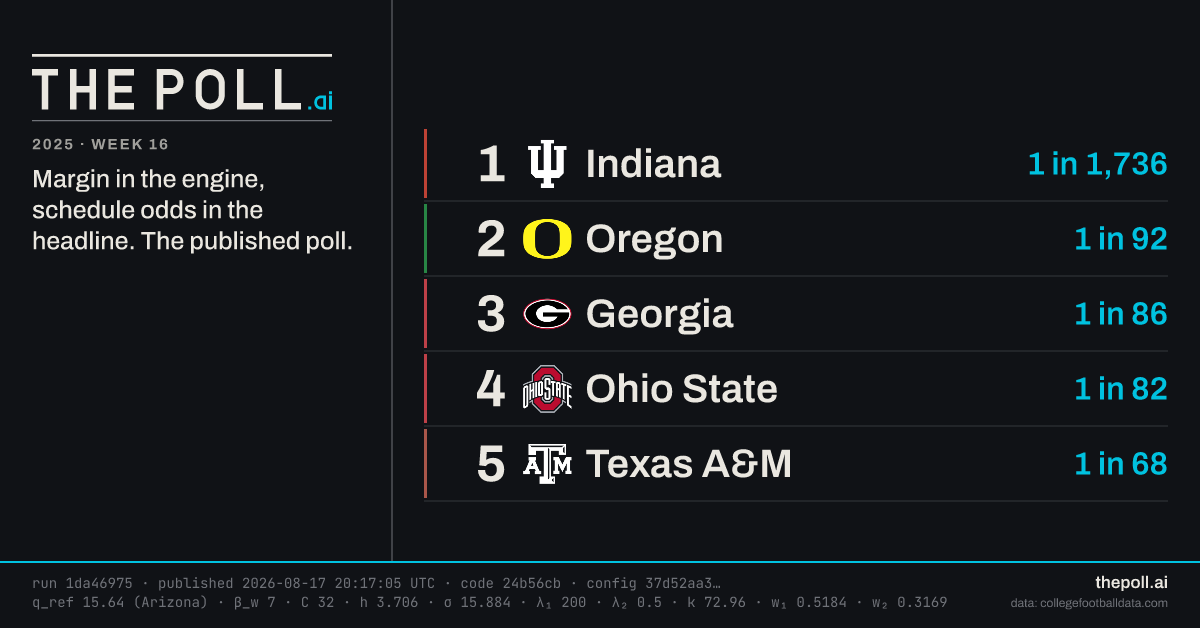
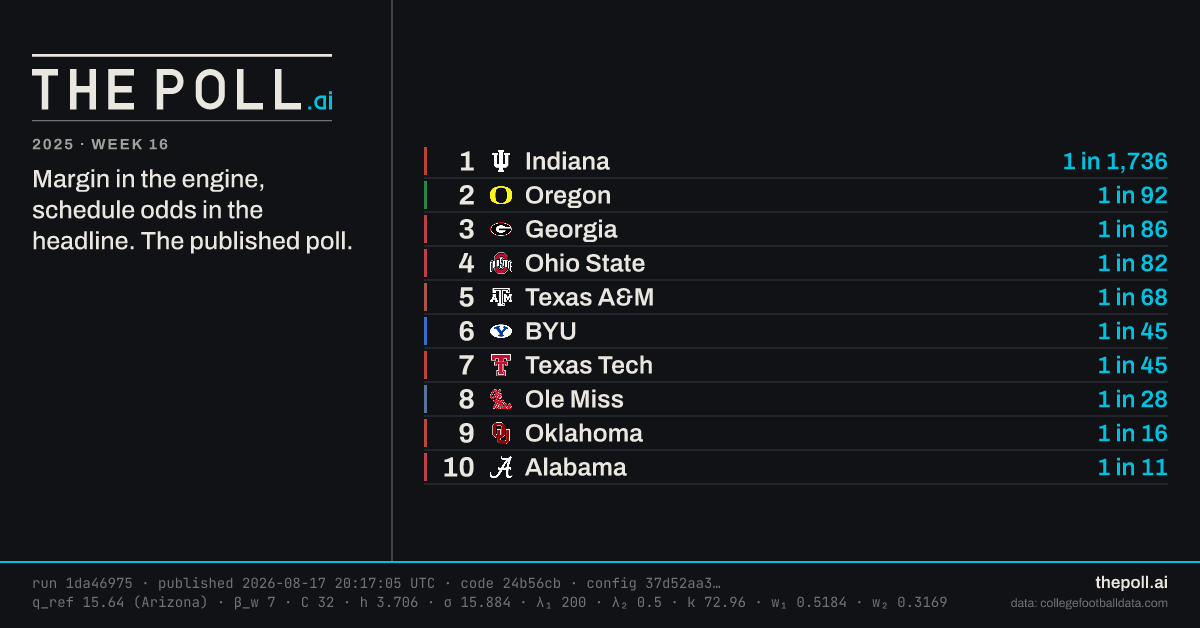
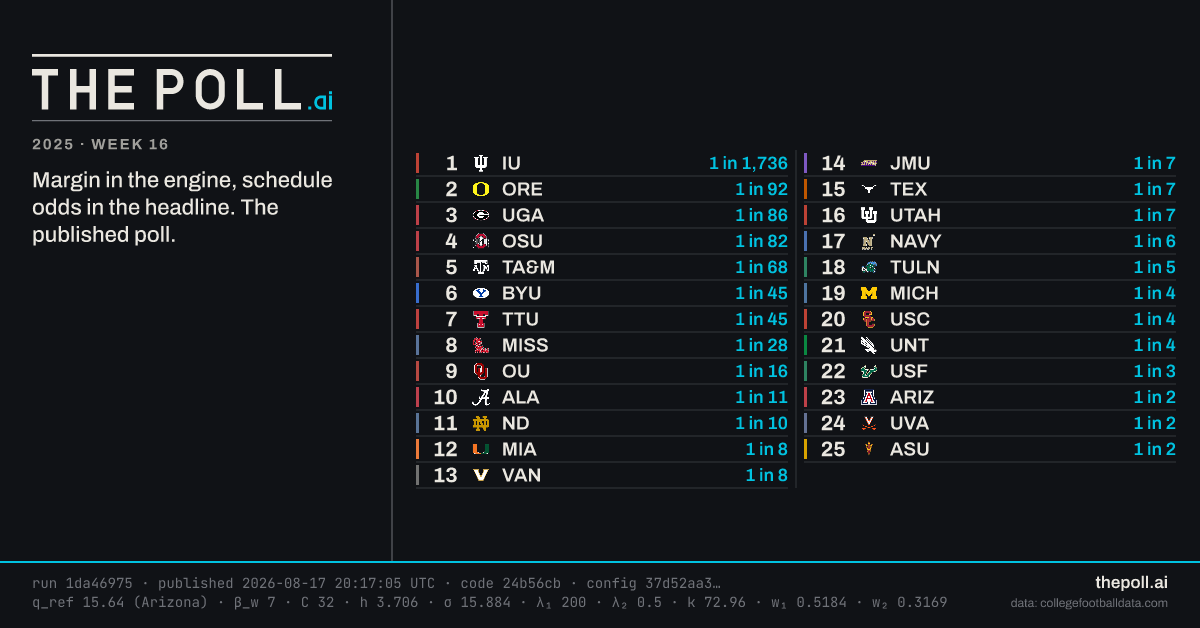
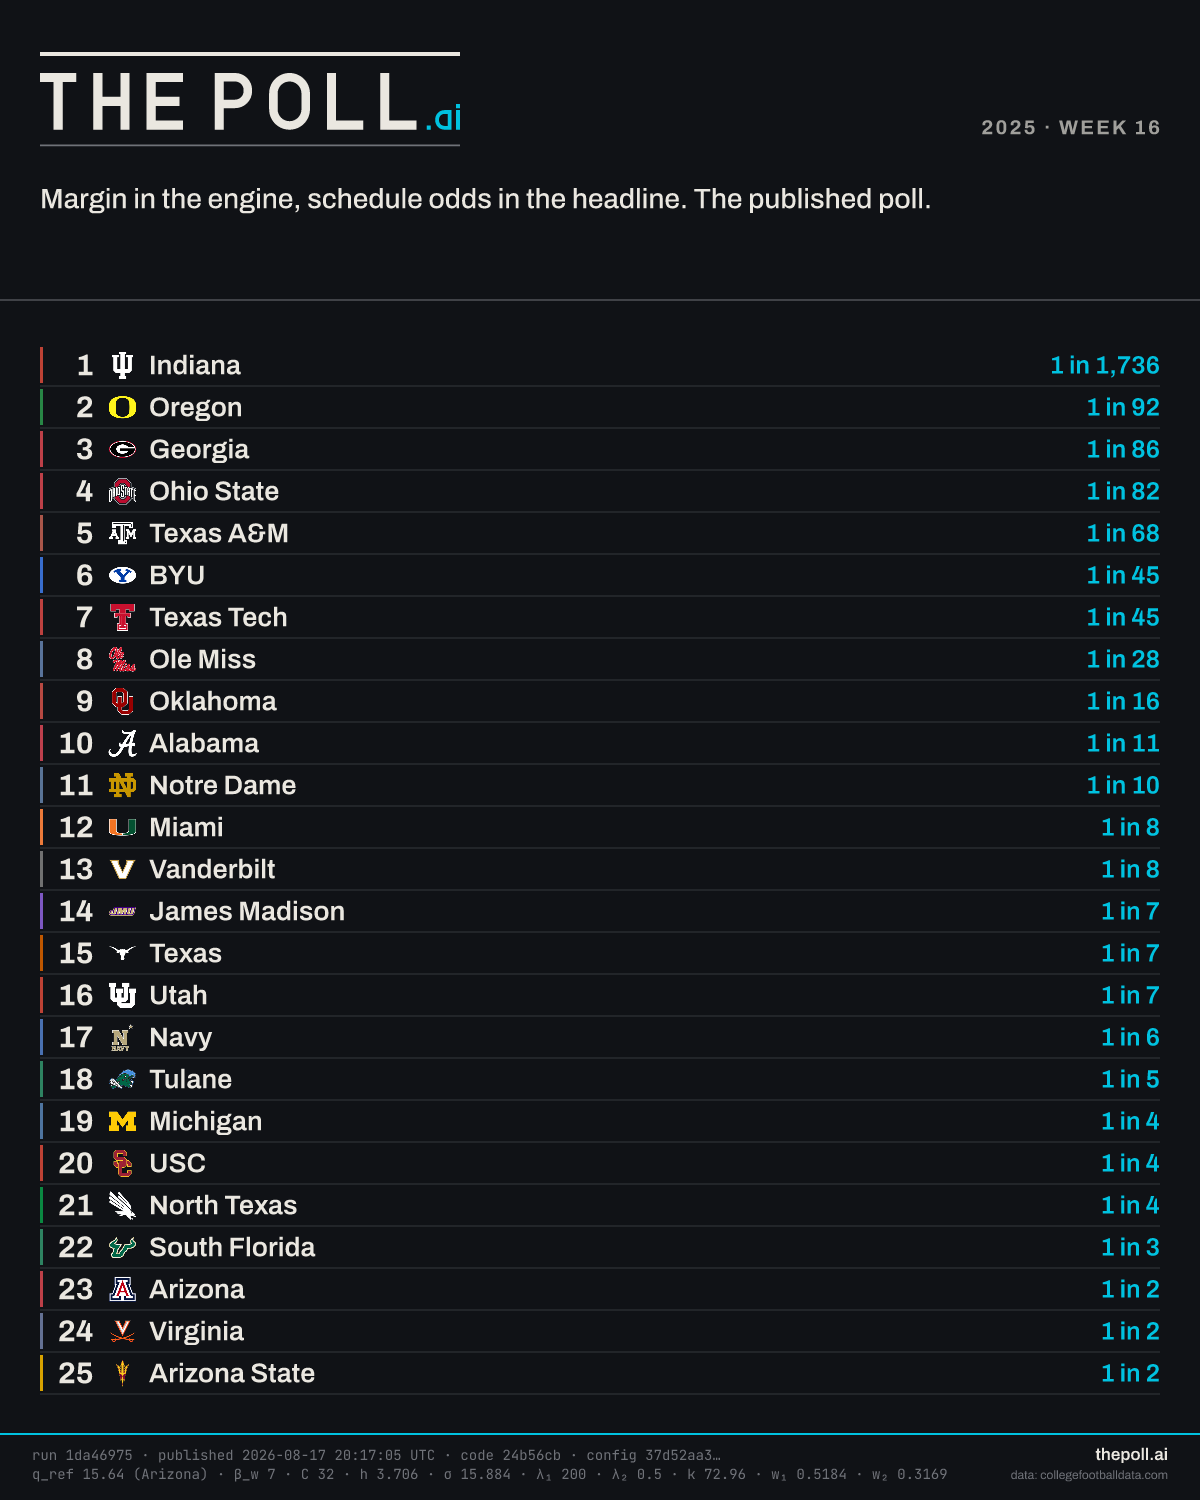
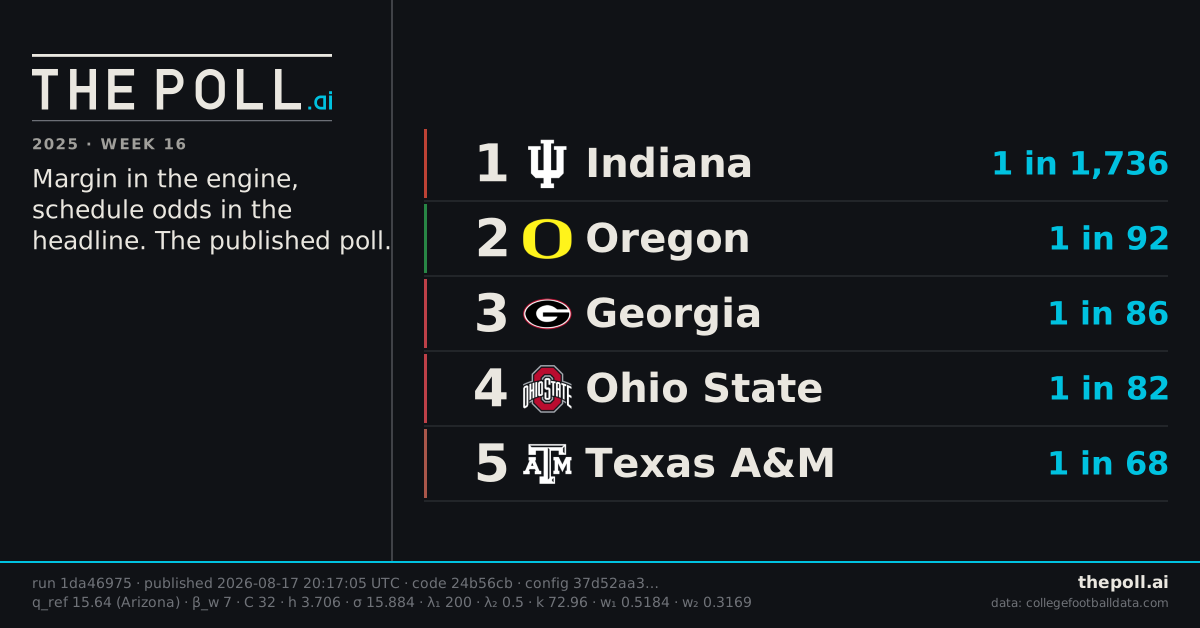
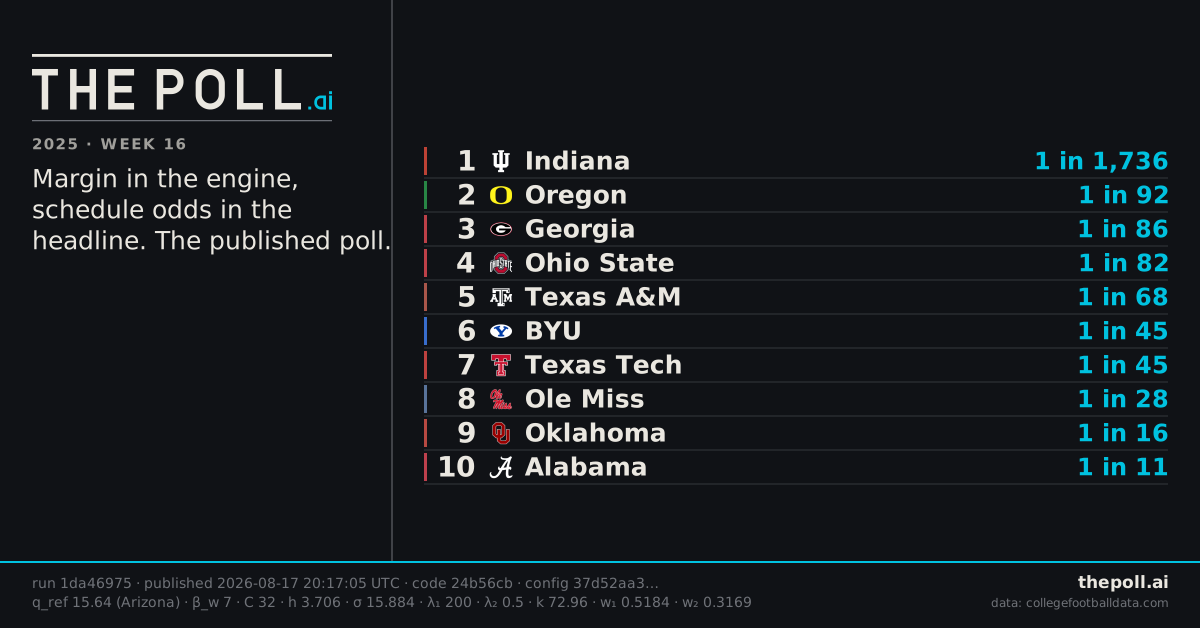
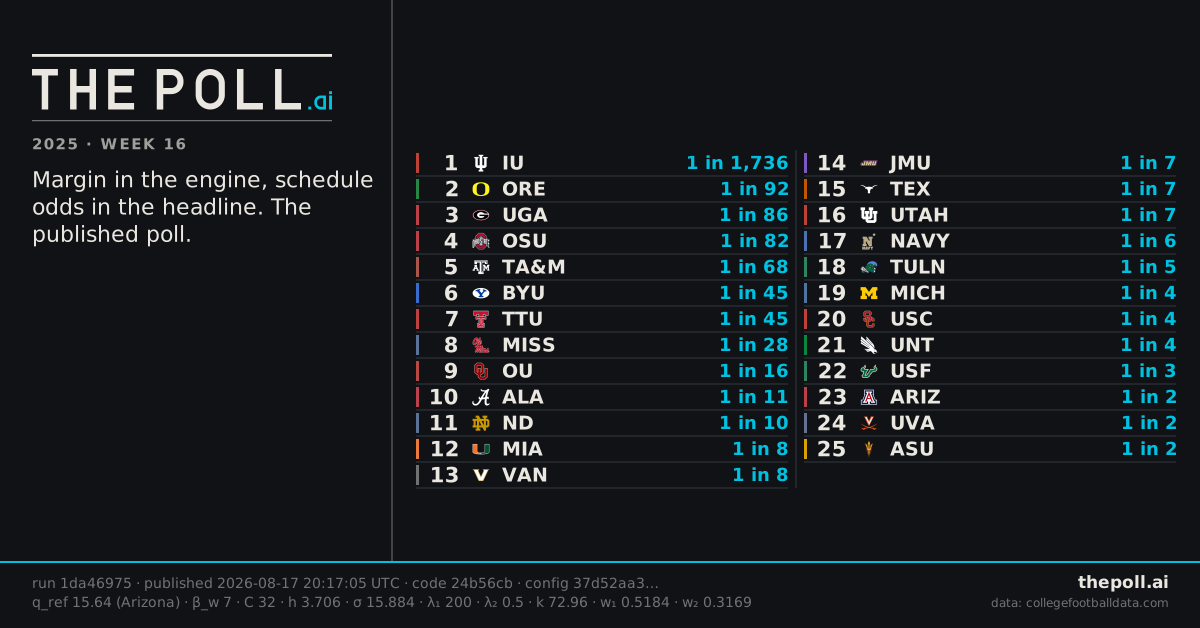
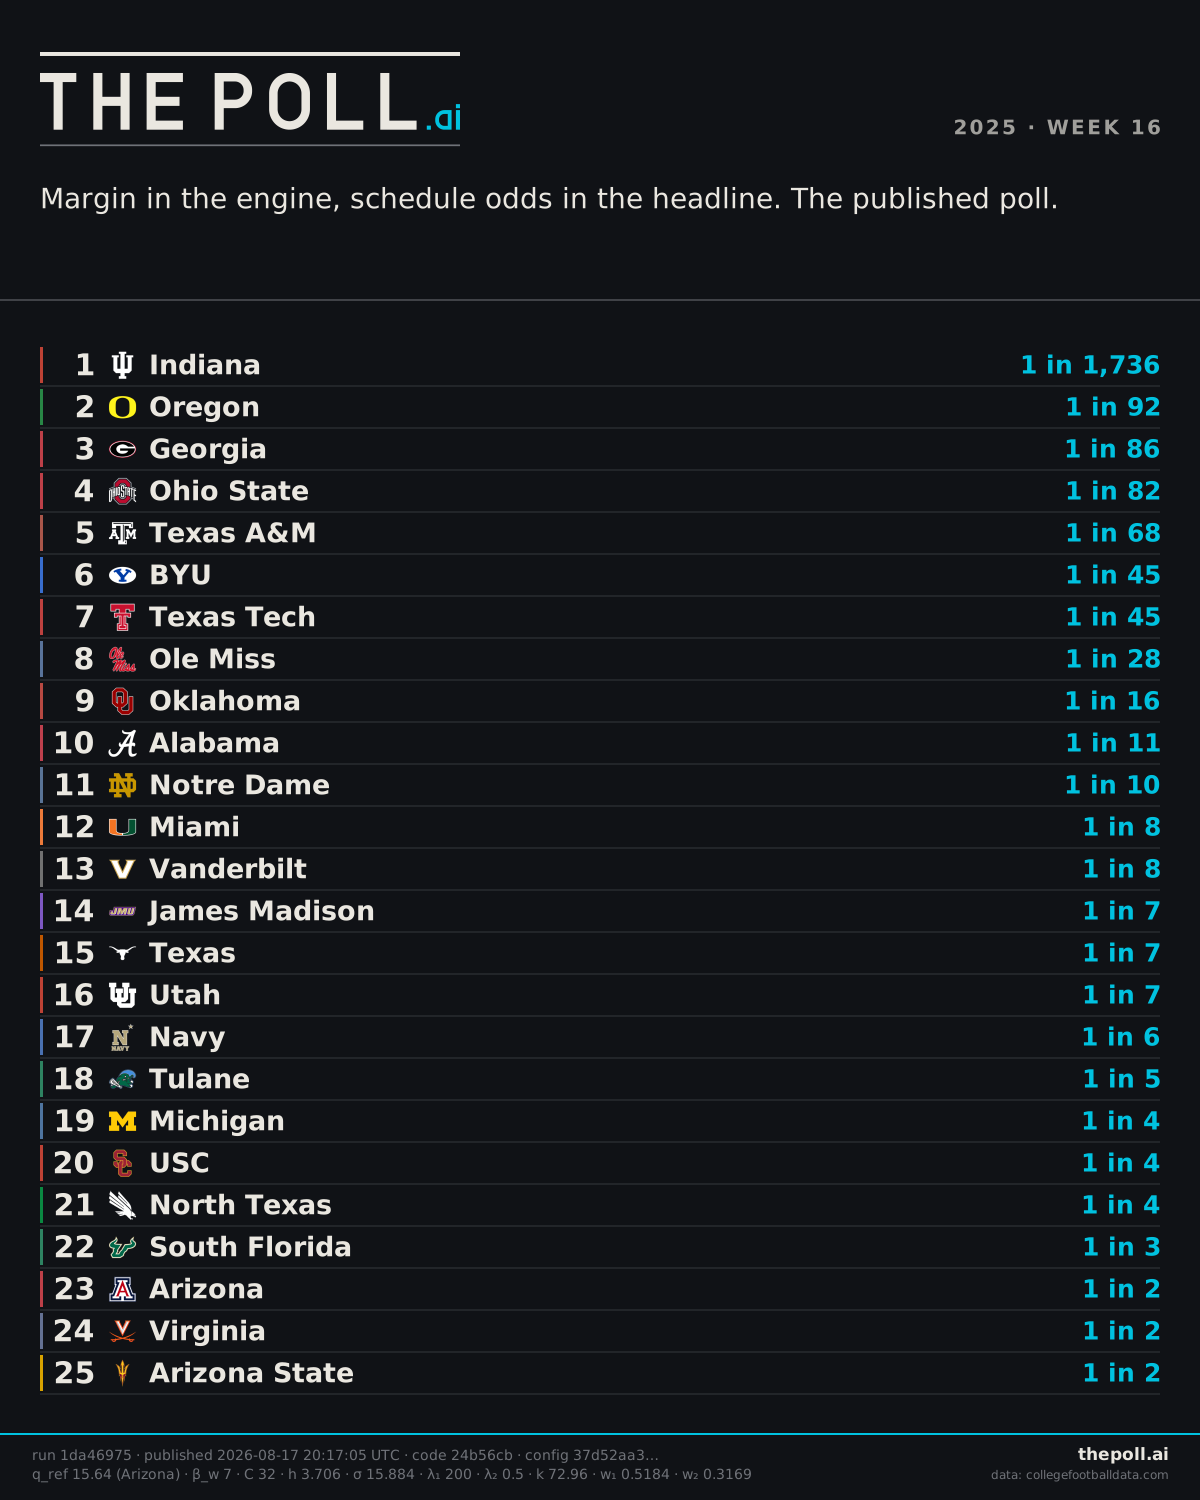
The right-hand number is how hard that season was to pull off against that exact schedule. One in 1,232 put Indiana on top. One in 2 was enough for 25th. Below about 1 in 5 it stops separating teams, which is what the smaller key underneath is for. The bar under each name is where the model kept landing that team out of 136, every bar on one scale. A typical bar this week spans 76 places.
2025 week 16 · f41abc9d · code b61a958 · Just Win · method b4343205 · 136 teams ranked
The tinted rows are the teams this lens moves at least five places, and each one carries both ranks.
Every column
The board above is the thirty-second version. Below it is everything the run published: the résumé, the power rating, the gap, the rank interval, and where the finished season puts each team.
Every figure the cards carry, for the 25 on the board, with nothing to click.
| # | team | record | how unlikely1 in this many | expectedwins this schedule asked for | beat that by | powerrating (rank) | gapplaces from the poll | rangein 90% of replays | hindsight |
|---|---|---|---|---|---|---|---|---|---|
| 1 | Indiana | 13-0 | 1 in 1,232 | 8.3 | +4.7 | 26.9 (2) | +33.1 | 1 to 24 | 0.0 |
| 2 | Oregon | 11-1 | 1 in 74 | 7.4 | +3.6 | 22.9 (5) | +11.4 | 1 to 37 | 0.0 |
| 3 | Ohio State | 12-1 | 1 in 68 | 8.4 | +3.6 | 26.1 (3) | +7.8 | 1 to 25 | 0.0 |
| 4 | Texas A&M | 11-1 | 1 in 54 | 7.6 | +3.4 | 20.5 (9) | +13.1 | 2 to 41 | 0.0 |
| 5 | Georgia | 12-1 | 1 in 80 | 8.0 | +4.0 | 19.7 (10) | +13.4 | 3 to 45 | 0.0 |
| 6 | Texas Tech | 12-1 | 1 in 41 | 8.8 | +3.2 | 28.3 (1) | +4.5 | 1 to 20 | 0.0 |
| 7 | Ole Miss | 11-1 | 1 in 24 | 8.1 | +2.9 | 14.6 (21) | +16.5 | 6 to 68 | 0.0 |
| 8 | BYU | 11-2 | 1 in 38 | 7.7 | +3.3 | 17.0 (16) | +12.9 | 4 to 62 | 0.0 |
| 9 | James Madison | 12-1 | 1 in 9 | 9.8 | +2.2 | 16.8 (17) | +10.0 | 2 to 57 | 0.0 |
| 10 | Oklahoma | 10-2 | 1 in 15 | 7.2 | +2.8 | 17.6 (14) | +8.4 | 4 to 51 | 0.0 |
| 11 | Notre Dame | 10-2 | 1 in 9 | 7.7 | +2.3 | 24.6 (4) | +0.1 | 1 to 28 | 0.0 |
| 12 | Vanderbilt | 10-2 | 1 in 7 | 7.9 | +2.1 | 20.5 (8) | +3.5 | 2 to 43 | -2.0 |
| 13 | Navy | 10-2 | 1 in 6 | 8.2 | +1.8 | 10.5 (36) | +13.4 | 10 to 93 | 0.0 |
| 14 | Miami | 10-2 | 1 in 7 | 7.9 | +2.1 | 21.3 (6) | +2.6 | 2 to 43 | +2.0 |
| 15 | Alabama | 10-3 | 1 in 10 | 7.5 | +2.5 | 17.6 (13) | +5.9 | 4 to 56 | 0.0 |
| 16 | Utah | 10-2 | 1 in 6 | 8.0 | +2.0 | 21.2 (7) | +2.1 | 2 to 44 | 0.0 |
| 17 | Texas | 9-3 | 1 in 6 | 7.1 | +1.9 | 14.6 (22) | +8.1 | 5 to 71 | -1.0 |
| 18 | Tulane | 11-2 | 1 in 6 | 9.1 | +1.9 | 8.8 (48) | +13.7 | 18 to 92 | +1.0 |
| 19 | North Texas | 11-2 | 1 in 4 | 9.4 | +1.6 | 17.6 (15) | +3.4 | 3 to 53 | 0.0 |
| 20 | Michigan | 9-3 | 1 in 4 | 7.6 | +1.4 | 15.1 (19) | +4.6 | 6 to 67 | -1.0 |
| 21 | USC | 9-3 | 1 in 3 | 7.7 | +1.3 | 18.6 (11) | +1.1 | 2 to 59 | +1.0 |
| 22 | South Florida | 9-3 | 1 in 3 | 7.8 | +1.2 | 17.8 (12) | +1.1 | 3 to 63 | 0.0 |
| 23 | Arizona | 9-3 | 1 in 2 | 8.3 | +0.7 | 12.5 (29) | +4.0 | 8 to 74 | -1.0 |
| 24 | Virginia | 10-3 | 1 in 2 | 9.3 | +0.7 | 13.4 (24) | +2.8 | 6 to 71 | +1.0 |
| 25 | Houston | 9-3 | 1 in 2 | 8.4 | +0.6 | 10.5 (37) | +5.6 | 11 to 91 | -1.0 |
Show the full table: top 25 of 136, every columnALTERNATE LENS. The same games, ranked on different beliefs.
| # | teamunderline: 90% rank interval · league median width 76 | how unlikely1 in this many |
|---|---|---|
| 1 | IndianaBig Ten | 3.0911 in 1,232 |
| 2 | OregonBig Ten | 1.8701 in 74 |
| 3 | Ohio StateBig Ten | 1.8341 in 68 |
| 4 | Texas A&MSEC | 1.7361 in 54 |
| 5 | GeorgiaSEC | 1.9011 in 80 |
| 6 | Texas TechBig 12 | 1.6111 in 41 |
| 7 | Ole MissSEC | 1.3861 in 24 |
| 8 | BYUBig 12 | 1.5811 in 38 |
| 9 | James MadisonSun Belt | 0.9551 in 9 |
| 10 | OklahomaSEC | 1.1701 in 15 |
| 11 | Notre DameFBS Independents | 0.9501 in 9 |
| 12 | VanderbiltSEC | 0.8741 in 7 |
| 13 | NavyAmerican Athletic | 0.7781 in 6 |
| 14 | MiamiACC | 0.8681 in 7 |
| 15 | AlabamaSEC | 0.9781 in 10 |
| 16 | UtahBig 12 | 0.8041 in 6 |
| 17 | TexasSEC | 0.7961 in 6 |
| 18 | TulaneAmerican Athletic | 0.7551 in 6 |
| 19 | North TexasAmerican Athletic | 0.6301 in 4 |
| 20 | MichiganBig Ten | 0.5581 in 4 |
| 21 | USCBig Ten | 0.5291 in 3 |
| 22 | South FloridaAmerican Athletic | 0.4811 in 3 |
| 23 | ArizonaBig 12 | 0.3371 in 2 |
| 24 | VirginiaACC | 0.3281 in 2 |
| 25 | HoustonBig 12 | 0.3111 in 2 |
What this board believes football results are for
Just Win, in its own words
If point differential pays, teams will run up the score on an opponent who cannot stop them. Everybody has seen it happen and nobody enjoyed it. This recipe takes the incentive off the table the only way a poll actually can, by refusing to look: the compression scale drops to a single point against a 7 point win premium, so margin can move a game's contribution by at most 1 point in 8 and beating someone by 70 is worth almost exactly what beating them by 1 is worth. There is nothing left to chase in the fourth quarter. The table is then ordered by the wins based resume, which asks one question and only one, what quality of team would have been expected to produce this record against this schedule. That is Colley's principle arrived at from the other direction, and the cost of it is written down below in full, because this recipe throws away real information on purpose and a reader is owed the size of what it threw away.
what it costs
- It throws away information that is genuinely there. A 70 point win and a 1 point win are not the same event and this recipe values them within about 15 percent of each other. That is the whole objection to Colley and it lands.
- It cannot move an unbeaten team, at all, ever. Expected wins approaches n from below, so an undefeated team has no finite root and every one of them lands on exactly the published bracket of +60, which is not a function of the schedule. The retroactive re-ranking that is this project's most differentiated product therefore cannot move an unbeaten team by a single place, in any week, in any direction. If September turns out to have been harder than it looked, this recipe cannot say so.
- No team with a loss can ever be ranked above an unbeaten team. Not rarely. Never, by construction, in every season measured. In 2021 that forced a 13-0 Cincinnati to number one ahead of Alabama, Georgia and Michigan, a position no independent judge reached.
- THE TIE-BREAK DOES NOT WORK AT THIS COMPRESSION, and the consequence is visible on the first four lines of the board. Under the house constants the margin aware resume separates teams sitting on the saturation bound, which is the one job it is kept for. At C = 1 that variant compresses too, so every unbeaten team saturates on BOTH columns and the order among them falls through to the last key in the sort, which is the team name. In 2023 the top four under this recipe is Florida State, Liberty, Michigan, Washington, in alphabetical order. That is not a ranking of those four teams. It is the absence of one, and the recipe has no way to produce a ranking of them because it has thrown away the only information that would distinguish them.
- Compressing to a single point is far outside anything the tuning campaigns searched. Campaign 1's grid opened at C = 18 and campaign 2 only widened it upward. This constant is a value judgement taken to its logical end, not a fitted number, and nothing in this repository claims it predicts well.
what it changed
- margin.beta_w7
- margin.c1
- publication.headline_orderingL4_resume
configs/recipes/just-win.toml
same evidence, different valuesEvery board on this page was fitted on the same 1,637 games, and the digest of that exact frame is 26f45004e64c under all three. Switching lens changes the constants above and nothing else. Method digest for this one: b43432059de8.
Where next
- Tune it yourself Move one setting and watch the board move.
- The revision What this week looked like once the season ended.
- Connectivity How much of the field was comparable, and what held it together.
- Methodology Every constant, every baseline, and the lines that say FAIL.