
2025 season · through week 16
Nobody voted on this.
Ranked by how hard each record was to get against the schedule that produced it. No preseason poll, no reputation, no conference name.
- 1Indiana13-01 in 2,079key 3.32
- 2Texas Techpoll has it 712-11 in 44key 1.64
- 3Ohio State12-11 in 102key 2.01
- 4Oregon11-11 in 111key 2.04
- 5Notre Damepoll has it 1110-21 in 9key 0.97
- 6Utahpoll has it 1610-21 in 7key 0.82
- 7Georgia12-11 in 91key 1.96
- 8Miami10-21 in 8key 0.91
- 9Texas A&M11-11 in 69key 1.84
- 10Ole Miss11-11 in 28key 1.45
- 11Vanderbilt10-21 in 8key 0.93
- 12BYUpoll has it 611-21 in 44key 1.64
- 13Alabama10-31 in 11key 1.05
- 14Oklahomapoll has it 910-21 in 16key 1.22
- 15South Floridapoll has it 229-31 in 3key 0.41
- 16James Madison12-11 in 6key 0.76
- 17USC9-31 in 4key 0.61
- 18North Texas11-21 in 3key 0.52
- 19Texas9-31 in 7key 0.84
- 20Washingtonpoll has it 328-41 in 2key 0.24
- 21Iowapoll has it 308-41 in 2key 0.31
- 22Michigan9-31 in 4key 0.63
- 23Arizona9-31 in 2key 0.35
- 24Missouri8-41 in 2key 0.27
- 25Tennesseepoll has it 318-41 in 2key 0.24
Take week 16 with you.
The board as it stood that week, drawn for a timeline.
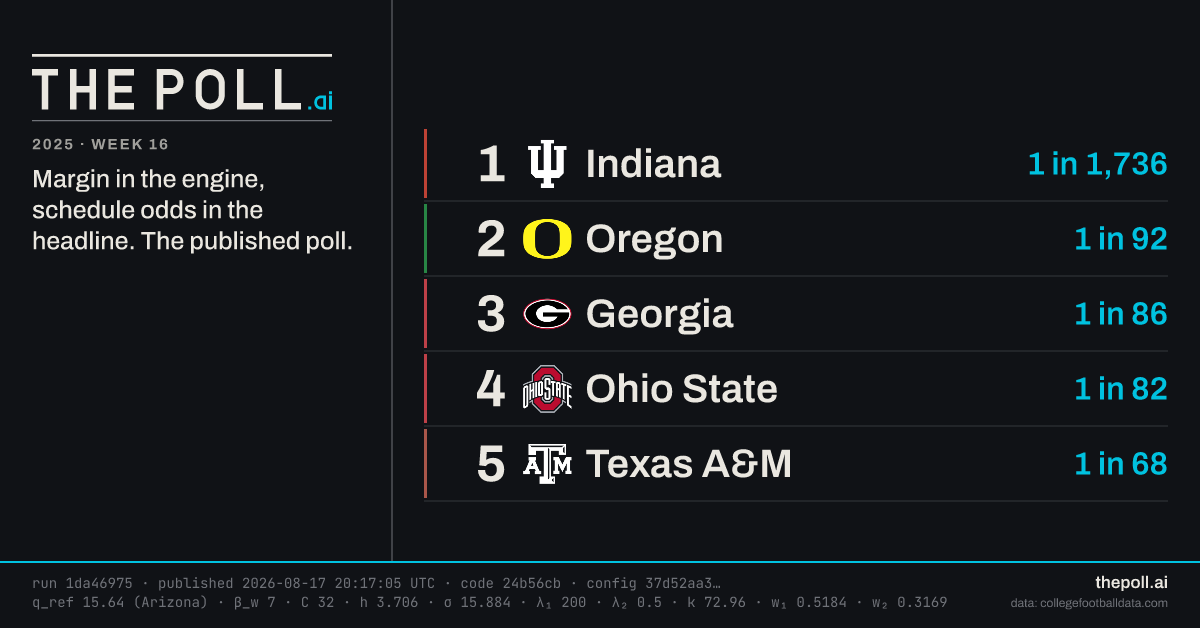
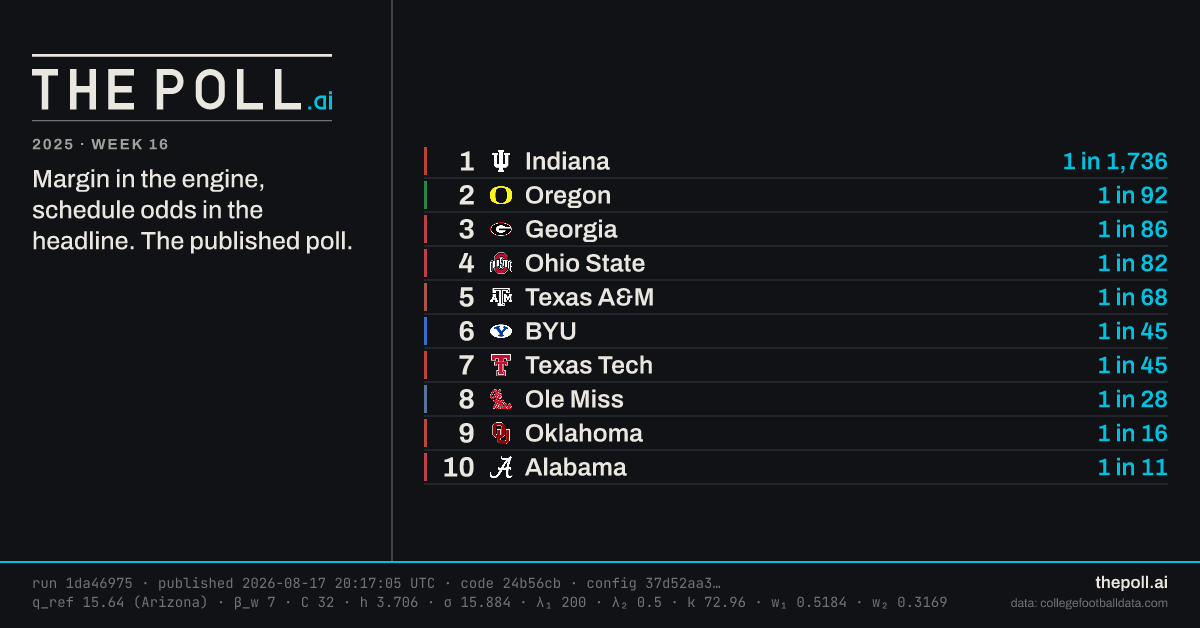
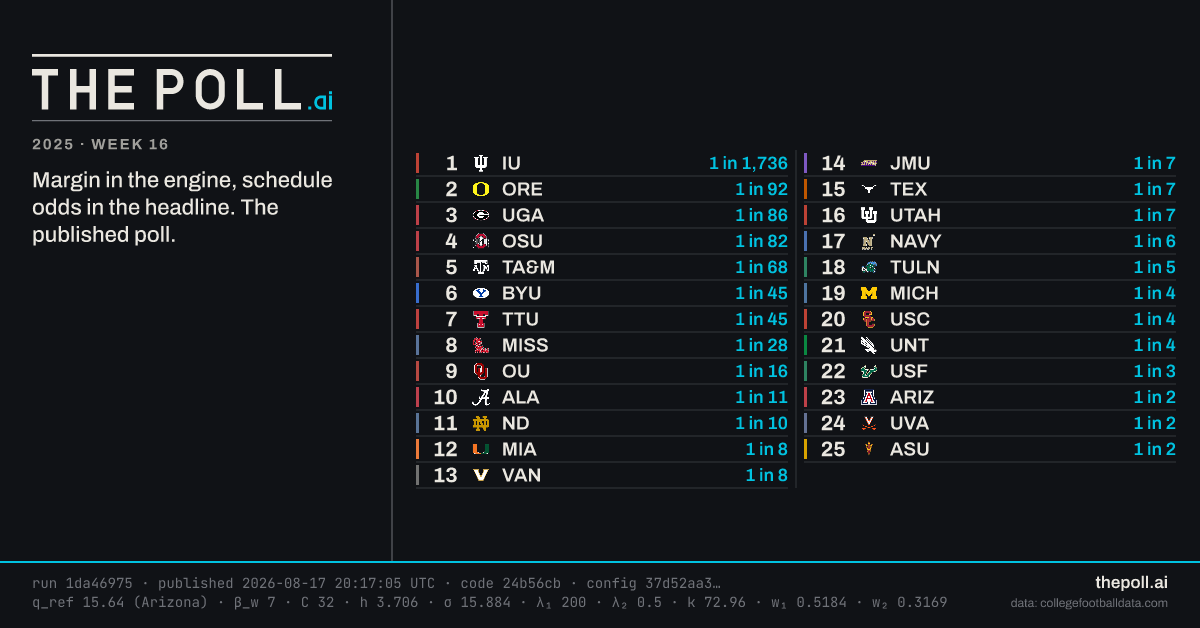
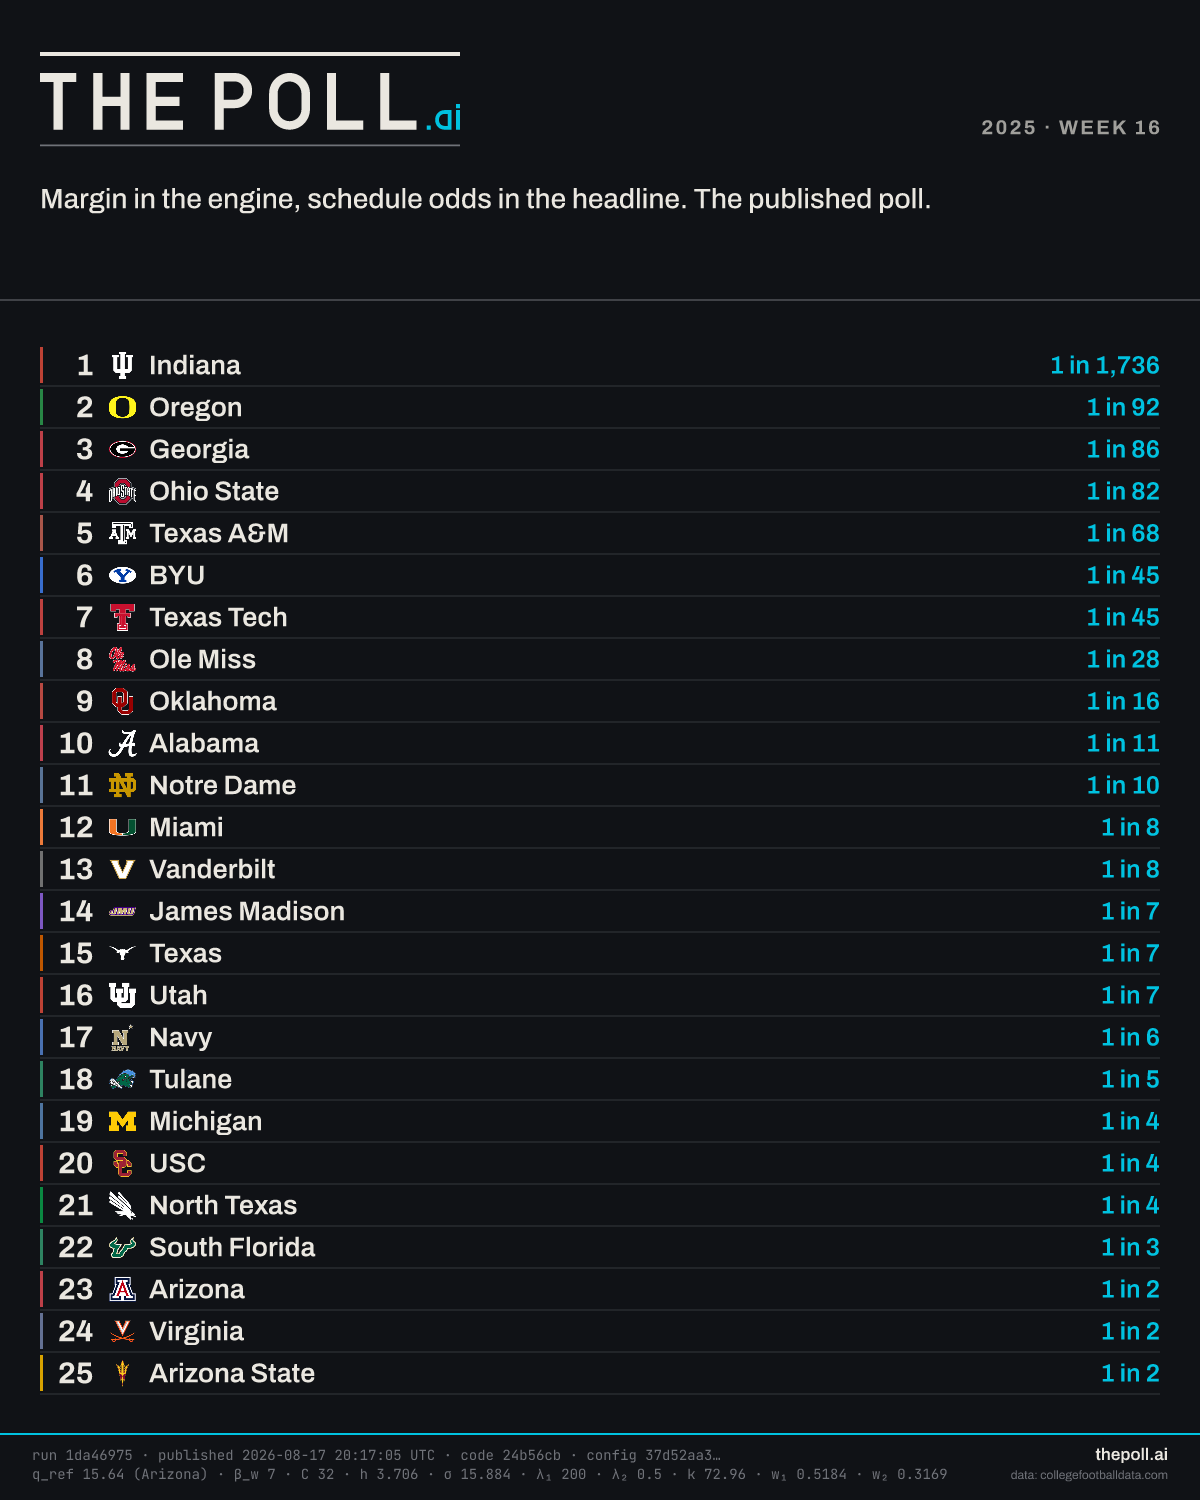
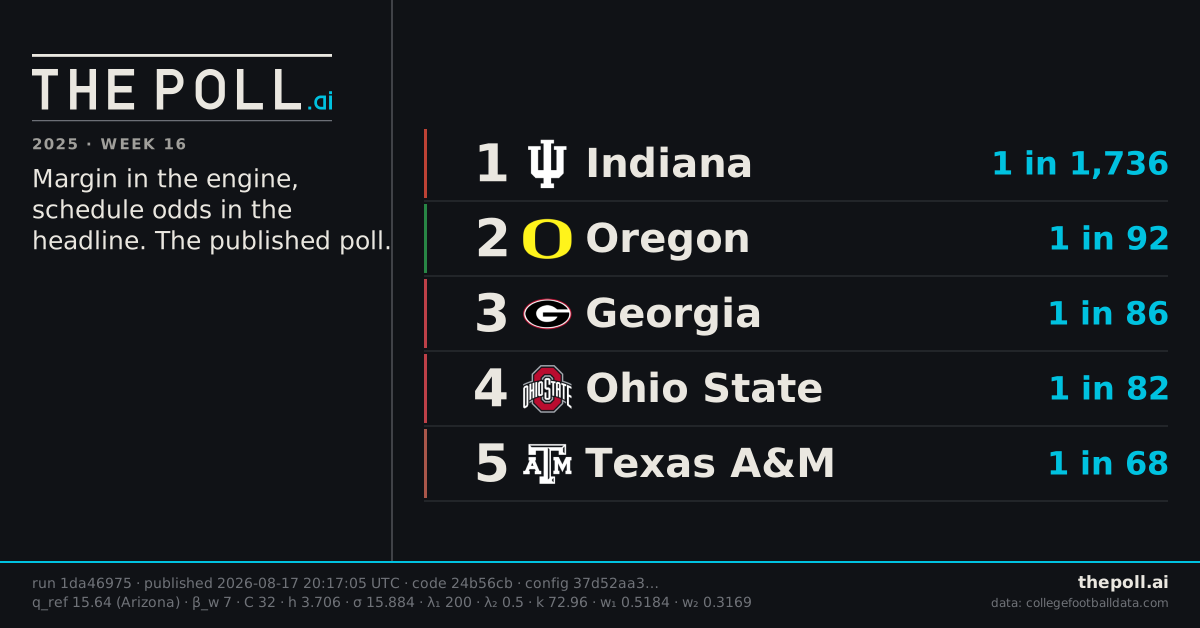
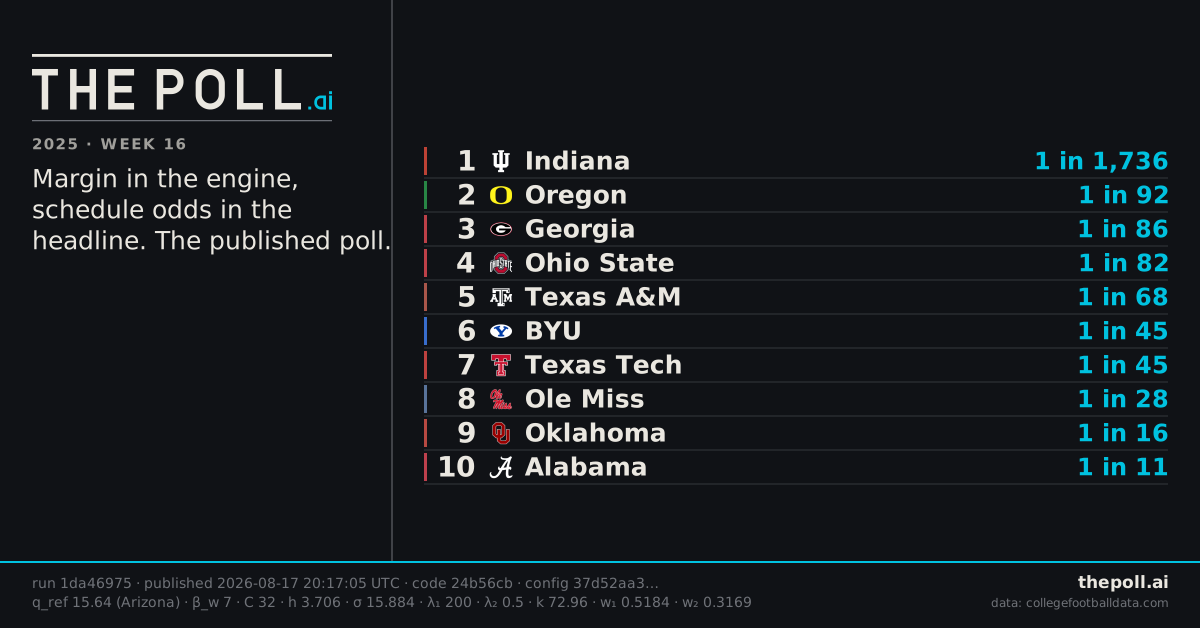
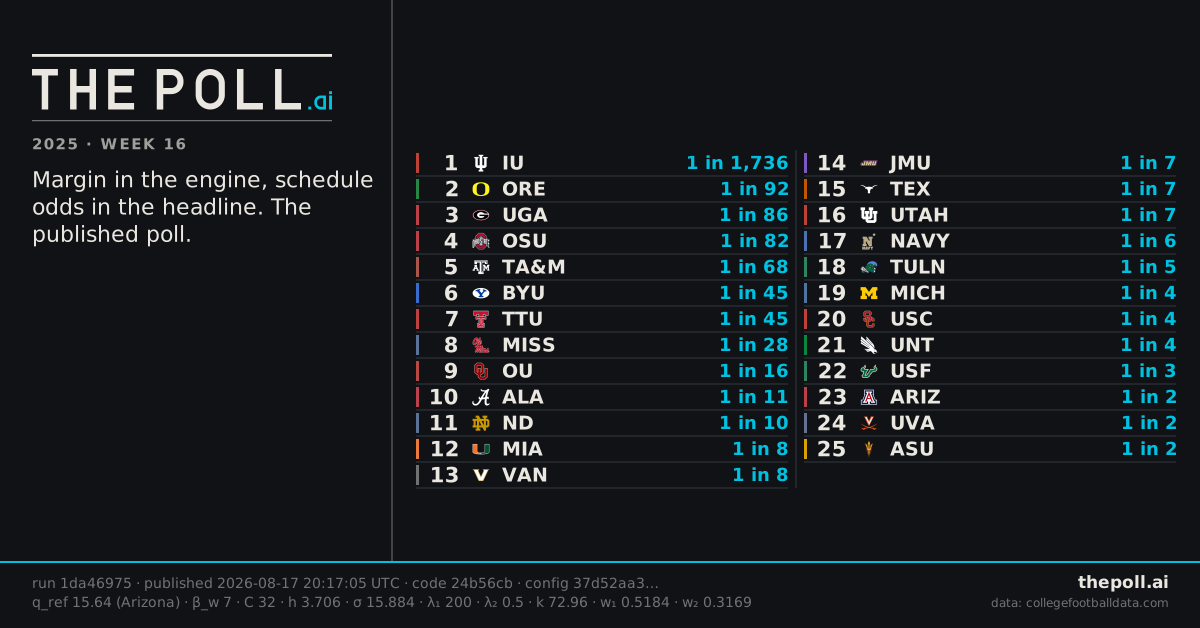
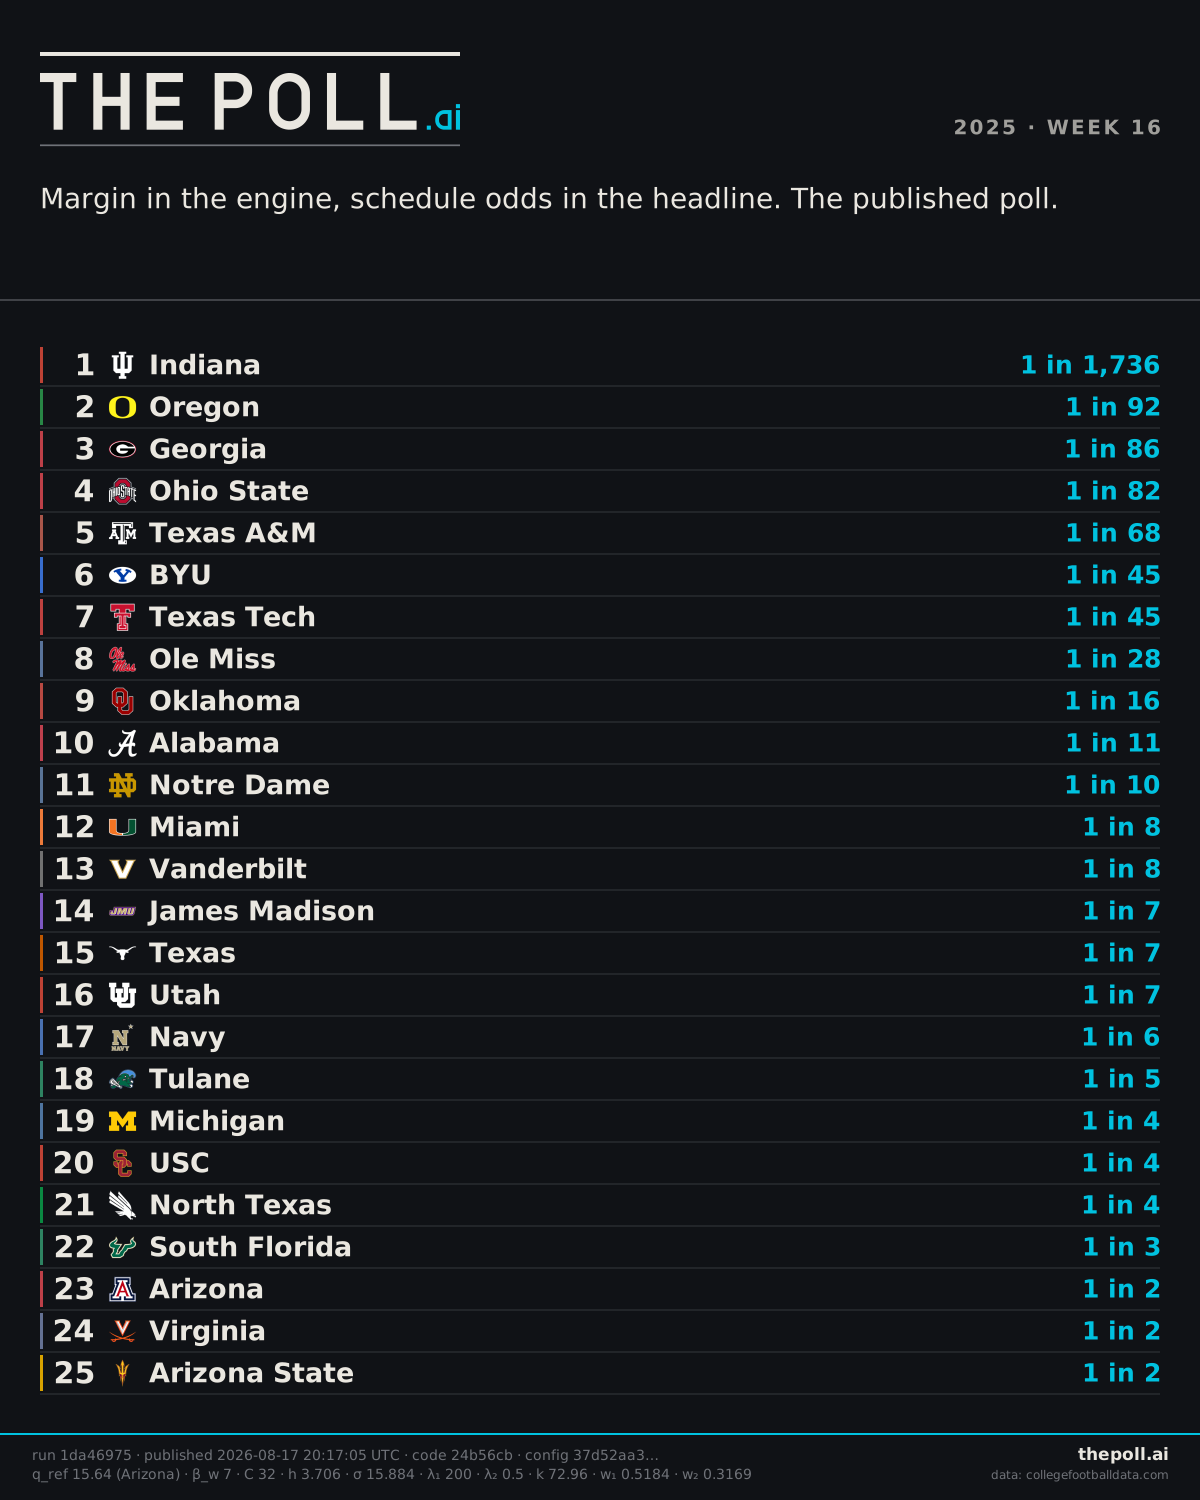
The right-hand number is how hard that season was to pull off against that exact schedule. One in 2,079 put Indiana on top. One in 2 was enough for 25th. Below about 1 in 5 it stops separating teams, which is what the smaller key underneath is for. The bar under each name is where the model kept landing that team out of 136, every bar on one scale. A typical bar this week spans 62 places.
2025 week 16 · f4eed303 · code b61a958 · Full Merit · method d21aaa06 · 136 teams ranked
The tinted rows are the teams this lens moves at least five places, and each one carries both ranks.
Every column
The board above is the thirty-second version. Below it is everything the run published: the résumé, the power rating, the gap, the rank interval, and where the finished season puts each team.
Every figure the cards carry, for the 25 on the board, with nothing to click.
| # | team | record | how unlikely1 in this many | expectedwins this schedule asked for | beat that by | powerrating (rank) | gapplaces from the poll | rangein 90% of replays | hindsight |
|---|---|---|---|---|---|---|---|---|---|
| 1 | Indiana | 13-0 | 1 in 2,079 | 8.2 | +4.8 | 32.7 (1) | +27.3 | 1 to 12 | 0.0 |
| 2 | Texas Tech | 12-1 | 1 in 44 | 8.8 | +3.2 | 31.7 (2) | +5.0 | 1 to 11 | -1.0 |
| 3 | Ohio State | 12-1 | 1 in 102 | 8.2 | +3.8 | 30.9 (3) | +7.8 | 1 to 15 | +1.0 |
| 4 | Oregon | 11-1 | 1 in 111 | 7.2 | +3.8 | 28.5 (5) | +10.3 | 1 to 21 | 0.0 |
| 5 | Notre Dame | 10-2 | 1 in 9 | 7.7 | +2.3 | 29.0 (4) | -0.6 | 1 to 19 | 0.0 |
| 6 | Utah | 10-2 | 1 in 7 | 8.0 | +2.0 | 25.7 (6) | +1.3 | 2 to 28 | 0.0 |
| 7 | Georgia | 12-1 | 1 in 91 | 8.0 | +4.0 | 23.8 (9) | +13.2 | 3 to 34 | -1.0 |
| 8 | Miami | 10-2 | 1 in 8 | 7.8 | +2.2 | 25.2 (7) | +2.7 | 2 to 31 | +1.0 |
| 9 | Texas A&M | 11-1 | 1 in 69 | 7.4 | +3.6 | 23.7 (10) | +14.1 | 3 to 37 | 0.0 |
| 10 | Ole Miss | 11-1 | 1 in 28 | 8.0 | +3.0 | 19.8 (18) | +15.3 | 6 to 51 | 0.0 |
| 11 | Vanderbilt | 10-2 | 1 in 8 | 7.8 | +2.2 | 23.9 (8) | +4.2 | 3 to 33 | 0.0 |
| 12 | BYU | 11-2 | 1 in 44 | 7.6 | +3.4 | 21.4 (14) | +12.3 | 5 to 45 | 0.0 |
| 13 | Alabama | 10-3 | 1 in 11 | 7.4 | +2.6 | 22.1 (12) | +5.5 | 5 to 44 | -1.0 |
| 14 | Oklahoma | 10-2 | 1 in 16 | 7.1 | +2.9 | 21.8 (13) | +8.0 | 5 to 42 | +1.0 |
| 15 | South Florida | 9-3 | 1 in 3 | 8.1 | +0.9 | 21.4 (15) | +0.2 | 4 to 41 | 0.0 |
| 16 | James Madison | 12-1 | 1 in 6 | 10.2 | +1.8 | 19.2 (20) | +9.2 | 5 to 42 | -1.0 |
| 17 | USC | 9-3 | 1 in 4 | 7.5 | +1.5 | 22.7 (11) | +1.5 | 4 to 43 | +1.0 |
| 18 | North Texas | 11-2 | 1 in 3 | 9.7 | +1.3 | 20.5 (16) | +2.9 | 5 to 42 | 0.0 |
| 19 | Texas | 9-3 | 1 in 7 | 7.0 | +2.0 | 18.6 (21) | +8.0 | 8 to 58 | -2.0 |
| 20 | Washington | 8-4 | 1 in 2 | 7.7 | +0.3 | 20.0 (17) | -2.0 | 7 to 54 | +1.0 |
| 21 | Iowa | 8-4 | 1 in 2 | 7.5 | +0.5 | 18.3 (23) | +1.1 | 8 to 62 | +1.0 |
| 22 | Michigan | 9-3 | 1 in 4 | 7.4 | +1.6 | 19.3 (19) | +4.9 | 8 to 59 | 0.0 |
| 23 | Arizona | 9-3 | 1 in 2 | 8.3 | +0.7 | 16.9 (25) | +3.3 | 9 to 63 | 0.0 |
| 24 | Missouri | 8-4 | 1 in 2 | 7.6 | +0.4 | 16.8 (26) | +2.0 | 9 to 63 | 0.0 |
| 25 | Tennessee | 8-4 | 1 in 2 | 7.8 | +0.2 | 18.4 (22) | -0.5 | 8 to 60 | 0.0 |
Show the full table: top 25 of 136, every columnALTERNATE LENS. The same games, ranked on different beliefs.
| # | teamunderline: 90% rank interval · league median width 62 | how unlikely1 in this many |
|---|---|---|
| 1 | IndianaBig Ten | 3.3181 in 2,079 |
| 2 | Texas TechBig 12 | 1.6431 in 44 |
| 3 | Ohio StateBig Ten | 2.0101 in 102 |
| 4 | OregonBig Ten | 2.0431 in 111 |
| 5 | Notre DameFBS Independents | 0.9711 in 9 |
| 6 | UtahBig 12 | 0.8191 in 7 |
| 7 | GeorgiaSEC | 1.9611 in 91 |
| 8 | MiamiACC | 0.9141 in 8 |
| 9 | Texas A&MSEC | 1.8371 in 69 |
| 10 | Ole MissSEC | 1.4501 in 28 |
| 11 | VanderbiltSEC | 0.9291 in 8 |
| 12 | BYUBig 12 | 1.6421 in 44 |
| 13 | AlabamaSEC | 1.0461 in 11 |
| 14 | OklahomaSEC | 1.2161 in 16 |
| 15 | South FloridaAmerican Athletic | 0.4121 in 3 |
| 16 | James MadisonSun Belt | 0.7621 in 6 |
| 17 | USCBig Ten | 0.6071 in 4 |
| 18 | North TexasAmerican Athletic | 0.5221 in 3 |
| 19 | TexasSEC | 0.8361 in 7 |
| 20 | WashingtonBig Ten | 0.2401 in 2 |
| 21 | IowaBig Ten | 0.3091 in 2 |
| 22 | MichiganBig Ten | 0.6321 in 4 |
| 23 | ArizonaBig 12 | 0.3451 in 2 |
| 24 | MissouriSEC | 0.2741 in 2 |
| 25 | TennesseeSEC | 0.2361 in 2 |
What this board believes football results are for
Full Merit, in its own words
Best team wins. We measure as fairly as we can, and nothing else counts. This recipe takes the scoreboard at face value: the compression is switched off entirely, so a 70 point win is a 70 point win and not a 40 point win with the top trimmed off, and the win premium goes to 12 points, the top of the grid campaign 2 pre-registered. The table is then ordered by the margin aware resume, which asks how good these results say you are rather than how hard it was to produce them. Garbage time is still filtered and a kneel down is still worth nothing, because running the clock out is a clock decision and not merit, and charging a defense for allowing it would be measuring the scoreboard operator. Everything that happened while both teams were still playing is on the table, at full value, with no thumb anywhere.
what it costs
- It pays to run up the score, and this recipe does not pretend otherwise. That is the entire objection to margin and this end of the axis does not answer it. If you believe a coach will keep the starters in against a beaten opponent when the poll rewards it, this is the recipe that rewards it.
- It is a worse resume and a better predictor, measured. The headline ordering here is candidate B of the headline ordering study, which lost retrodictive violations to both alternatives in 16 of 16 season by surface cells and won forward ordering accuracy 0.6822 against 0.6626. Report 02 already ships a predictor: the Power column, on every row, every week.
- It puts teams with losses above teams without them, hard. In 2023 candidate B ranked an 8-4 Kansas State twelfth and a 7-5 Texas A&M twenty-third, above an 11-1 James Madison and a 13-0 Liberty, because beating people badly and losing narrowly is what it rewards. demo/2023-recipes.md measures this exact combination of constants rather than quoting the study's.
- The data does like these constants, and that cuts both ways. C uncapped with a 12 point win premium is campaign 2's lead 1: it beat the incumbent on margin MAE on the tune seasons (13.0039 against 13.0102) and again on 2024 (12.8536 against 12.9096), cleared its own pre-registered rule, and was blocked by an interaction with the accumulation window rather than by its own result. The objective it won on is margin MAE, which has no opinion about desert whatsoever.
- Kendall's tau against the house poll on the 2023 final board is far below the 0.985 the project treats as the line between a convention and a dial. This is a dial. It is meant to be one.
what it changed
- margin.beta_w12
- margin.cuncapped
- publication.headline_orderingL4_resume_margin
configs/recipes/full-merit.toml
same evidence, different valuesEvery board on this page was fitted on the same 1,637 games, and the digest of that exact frame is 26f45004e64c under all three. Switching lens changes the constants above and nothing else. Method digest for this one: d21aaa06428f.
Where next
- Tune it yourself Move one setting and watch the board move.
- The revision What this week looked like once the season ended.
- Connectivity How much of the field was comparable, and what held it together.
- Methodology Every constant, every baseline, and the lines that say FAIL.